Tech Behind Market Rally
Since hitting a low in March, stocks rallied nearly 20% to extend its ninth straight weekly advance for the longest run since 2023. This long streak has only occurred a few times over the last four decades. Over the last three months U.S. large-cap growth stocks are up 16.8%, while U.S. large-cap value stocks are up 3.2%. The growth segment has been led by technology rising 31% during that period. The performance has been largely a result of stronger earnings growth – the S&P 500 index is expected to grow 22.4% in 2026 and 14.8% in 2027, with technology being one of the larger contributing factors to earnings growth.
2026 Earnings Growth To Be Led by Mag 7, Information Technology, Materials, Energy
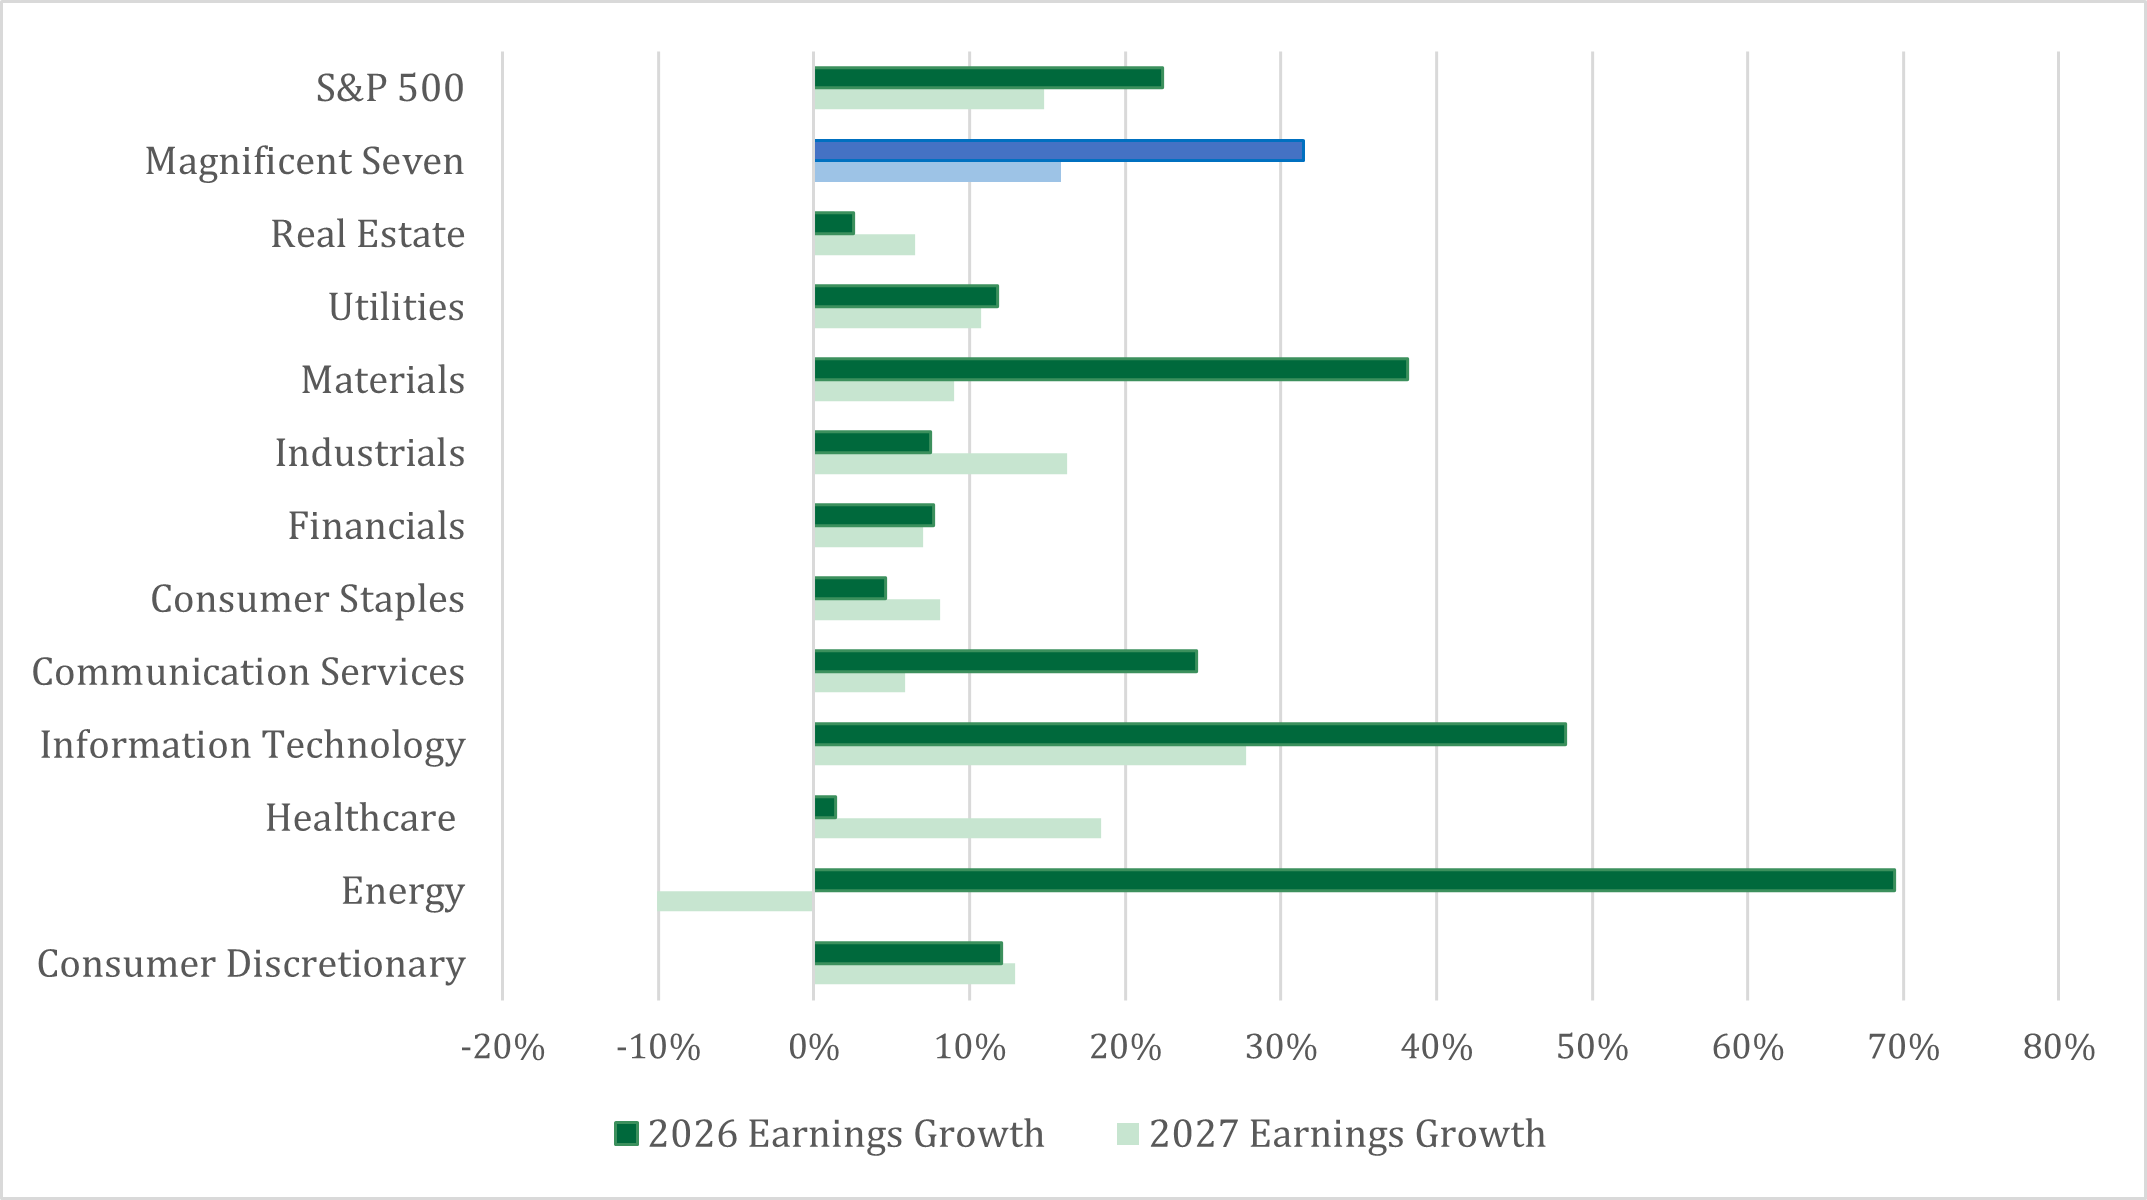
Meta Platforms, Tesla
Value Segment: Utilities, Consumer Staples, Healthcare, Financials
Record Q1 Earnings Season led by Technology
Last quarter, the blended earnings growth rate for the S&P 500 totaled 28.4%, which would be the highest since Q4 2021. On March 31, the earnings growth was expected to be 13%. The catalyst behind the upside in earnings growth was a result of the Magnificent 7 (the seven largest technology stocks in the S&P 500) reporting a massive positive EPS surprise, exceeding estimates by 32.5%. The Magnificent 7 reported an actual earnings growth of 63.2% for the first quarter, slightly below the highest growth rate that these companies reported in Q2 2021 at 89.2%. The blended earnings growth rate for the rest of the companies in the S&P 500 was 17.4%.
Inflation Accelerates on Rising Energy Costs
The consumer price index, a measure of the average change over time in prices paid by consumers, ascended to a 3.8% year-over-year level in April, the highest level since 2023. Costs of groceries and gasoline contributed the most to the higher inflation print. The April inflation report showed that gas prices rose almost 28% over the past two months and grocery prices, which includes items such as meats, dairy, fresh fruits and vegetables, rose by 0.7%, the most in four years. Even excluding food and energy prices, consumer prices increased 0.4% from a month earlier and 2.8% from a year earlier on shelter costs rising the most in two years.
Settling of Oil Prices
Consistent with the previous months, the price of oil traded in line with the conflict in the Middle East. As tensions heated up, the price of oil increased and when tensions subsided, the price of oil followed. In May, global oil prices declined more than 20%, with Brent crude oil settling at $92.05 a barrel. Investors are expecting a long-term cease fire deal that could ease disruptions and resume global trade. However, U.S. Department of Energy data showed that distillate fuel declined to the lowest level since May 2003, which expresses how tight the energy environment remains.
Rate Volatility on Full Display
The 10-year Treasury yield went on a ride in May, advancing to a high of 4.67%, eventually settling at 4.44%. The volatility in longer-term interest rates can be attributed to higher oil prices driving up inflation. Even short-term interest rates increased, with the 2-year Treasury yield rising to 4%. Market participants have started increasing their bets on Federal Reserve rate hikes in 2026, given the better economic data and higher inflation prints. At the end of May, investors leaned more to a rate hike as opposed to a rate cut in 2026.
Although we believe it to be reliable as of the publication date and have sought to take reasonable care in its preparation, all information provided is FOR INFORMATIONAL PURPOSES ONLY and we make no representations or warranties regarding its accuracy, reliability, or completeness and assume no duty to make any updates in the event of future changes. Past performance may not be indicative of future market results. Any examples used (including specific securities) are generic and meant for illustration purposes only and are not, and should not be interpreted as, offers to buy or sell such securities. To the extent indices are referenced, please note that you are not able to invest directly in an index.
Nicolet Wealth Management is a brand name that refers to Nicolet National Bank and certain of its departments and affiliates that provide investment advisory, trust, retirement plan level services, and insurance services. Investment advisory services offered through Nicolet Advisory Services, LLC (dba Nicolet Wealth Management), a registered investment advisor.
All investments are subject to risks, including possible loss of principal, and are: NOT FDIC INSURED; NOT INSURED BY ANY FEDERAL GOVERNMENT AGENCY; AND NEITHER DEPOSITS OR OTHER OBLIGATIONS OF, NOR GUARANTEED BY, Nicolet National Bank or any of its affiliates. Neither Nicolet Advisory Services nor its affiliates offer tax or legal advice. You should consult with your legal and tax professionals before making investment decisions.

Listen & Subscribe to our Podcast
Tune in for the next episode, subscribe or follow us wherever you listen to podcasts.