


SEE THROUGH THE NOISE
Objectivity is a key attribute to investing - focusing on data rather than emotions and market noise. Despite the near market correction (prices declining more than -10%) in March on an acceleration of tensions in the Middle East, the S&P 500 index, a benchmark that represents that largest U.S. stocks, returned to set all-time highs in April and May for a return of more than 10.3% this year through May 26th. Amidst the conflict, the S&P 500 index reported a record first-quarter earnings season.
S&P 500 EARNINGS HAVE BEEN MORE THAN MAGNIFICENT
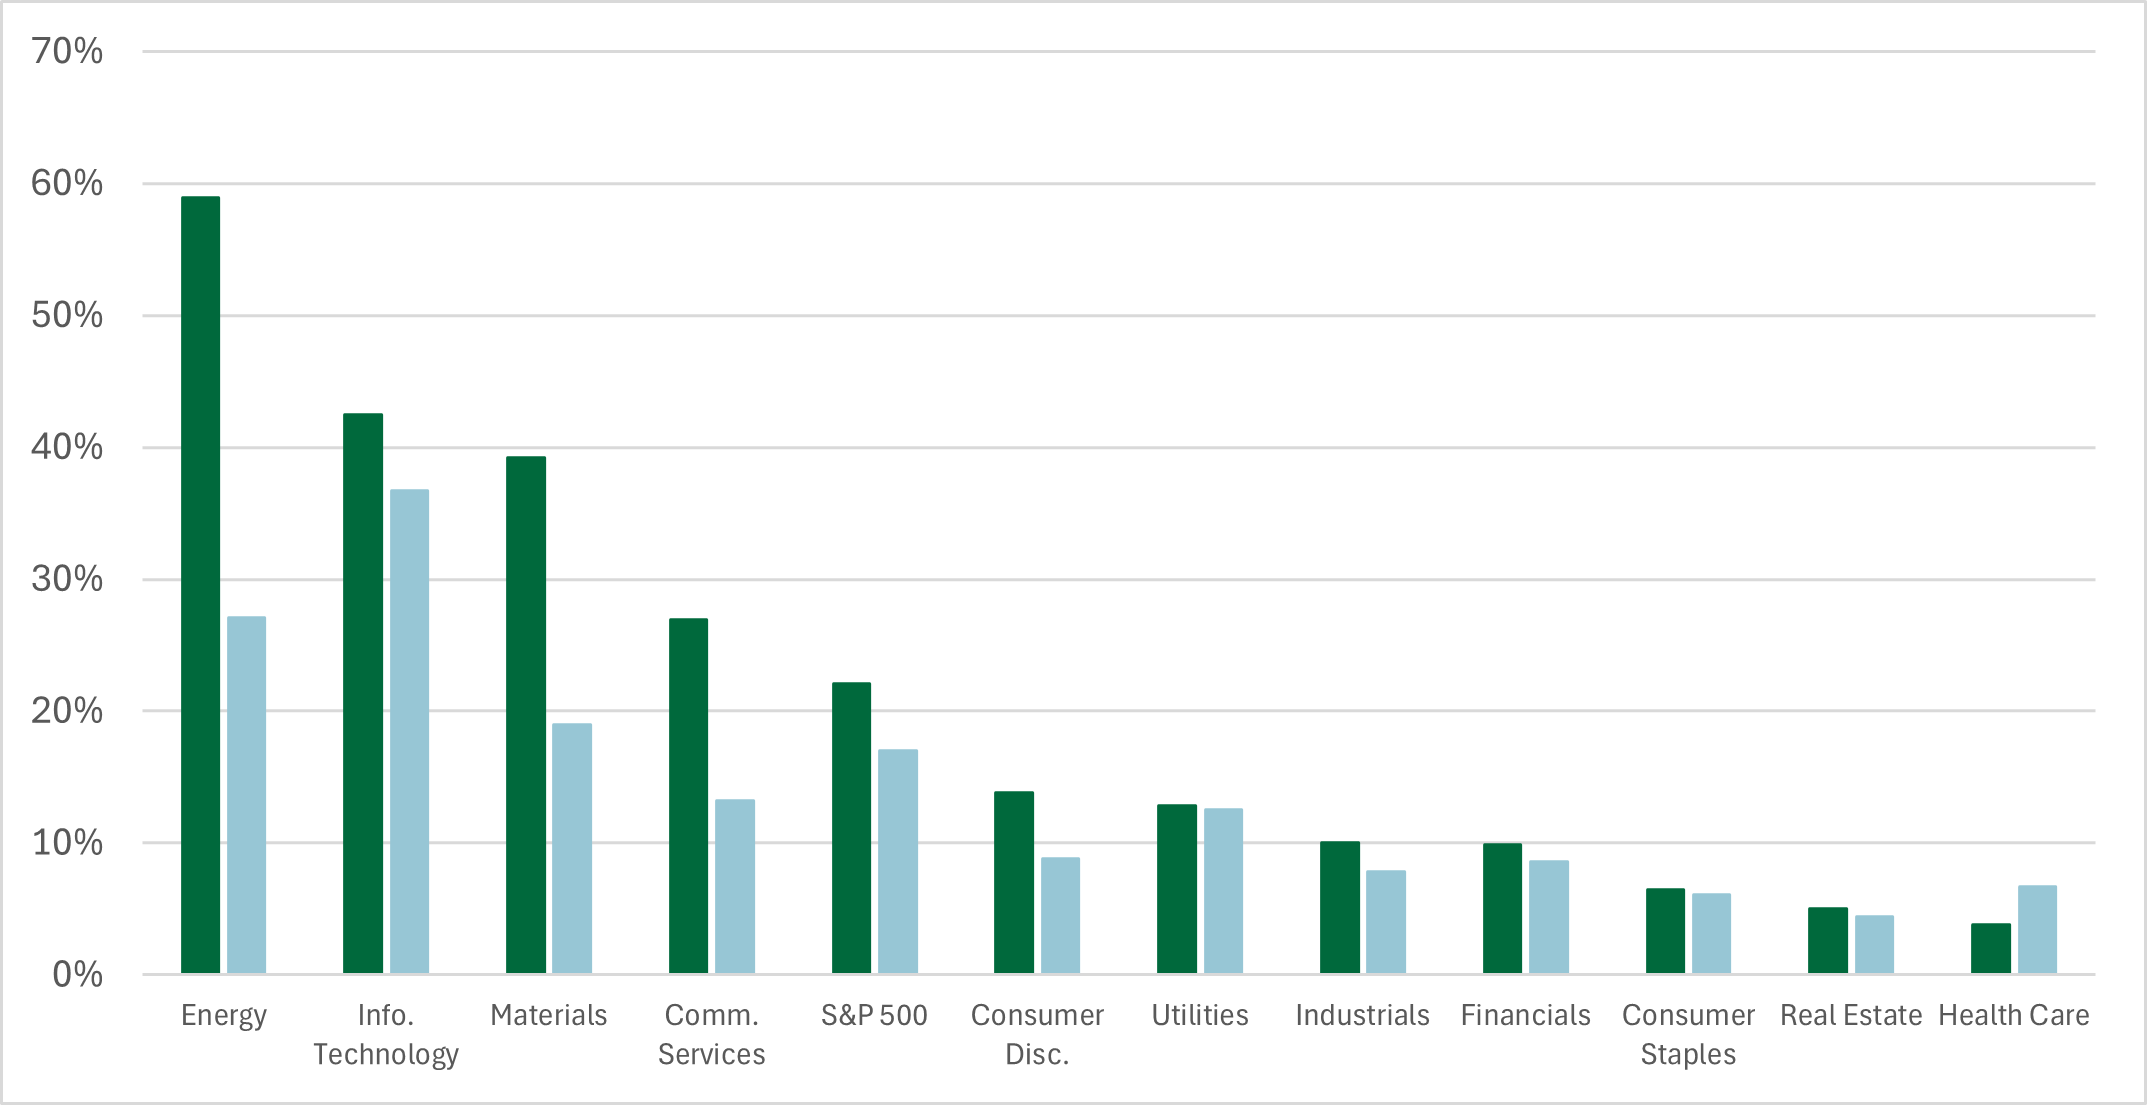
In the first quarter of 2026, the S&P 500 index exhibited earnings growth of 25.1%, driven by an increase in sales at 10.5% on a year-over-year basis. The most important development from the current earnings season was the breadth of the results, with many participants contributing to the robust earnings season. For example, 85% of companies beat estimates, compared to the historical average of 74%. The earnings topped original estimates by 8.6% in aggregate, surpassing the long-term average of 4.9%. This earnings season had one of the highest earnings growth in 4 years, and an argument can be made in the last two decades, if one-time base effects were ignored. A better economic backdrop is the catalyst behind the stronger earnings results.
2026 S&P 500 Earnings Growth (Y/Y): Sectors

U.S. ECONOMIC SUPERIORITY
There are two catalysts behind the improving U.S. economic backdrop: consumption stability and outsized capital investment. First, consumption exuberance can be traced by employment gains. At first blush, it would appear the employment picture is weakening, as monthly job additions have stagnated over recent months with average monthly job additions having totaled 66,000 since April 2025 and 139,000 since January 2024. However, based on Goldman Sachs research, the number of jobs needed to be added monthly to keep the unemployment rate from rising is about 65,000 and could get as low as 50,000 by the end of the year. Slowing net immigration is the prominent reason for such a low breakeven rate of gains, which has capped labor force growth.
Labor Market: Choppiness in Job Additions
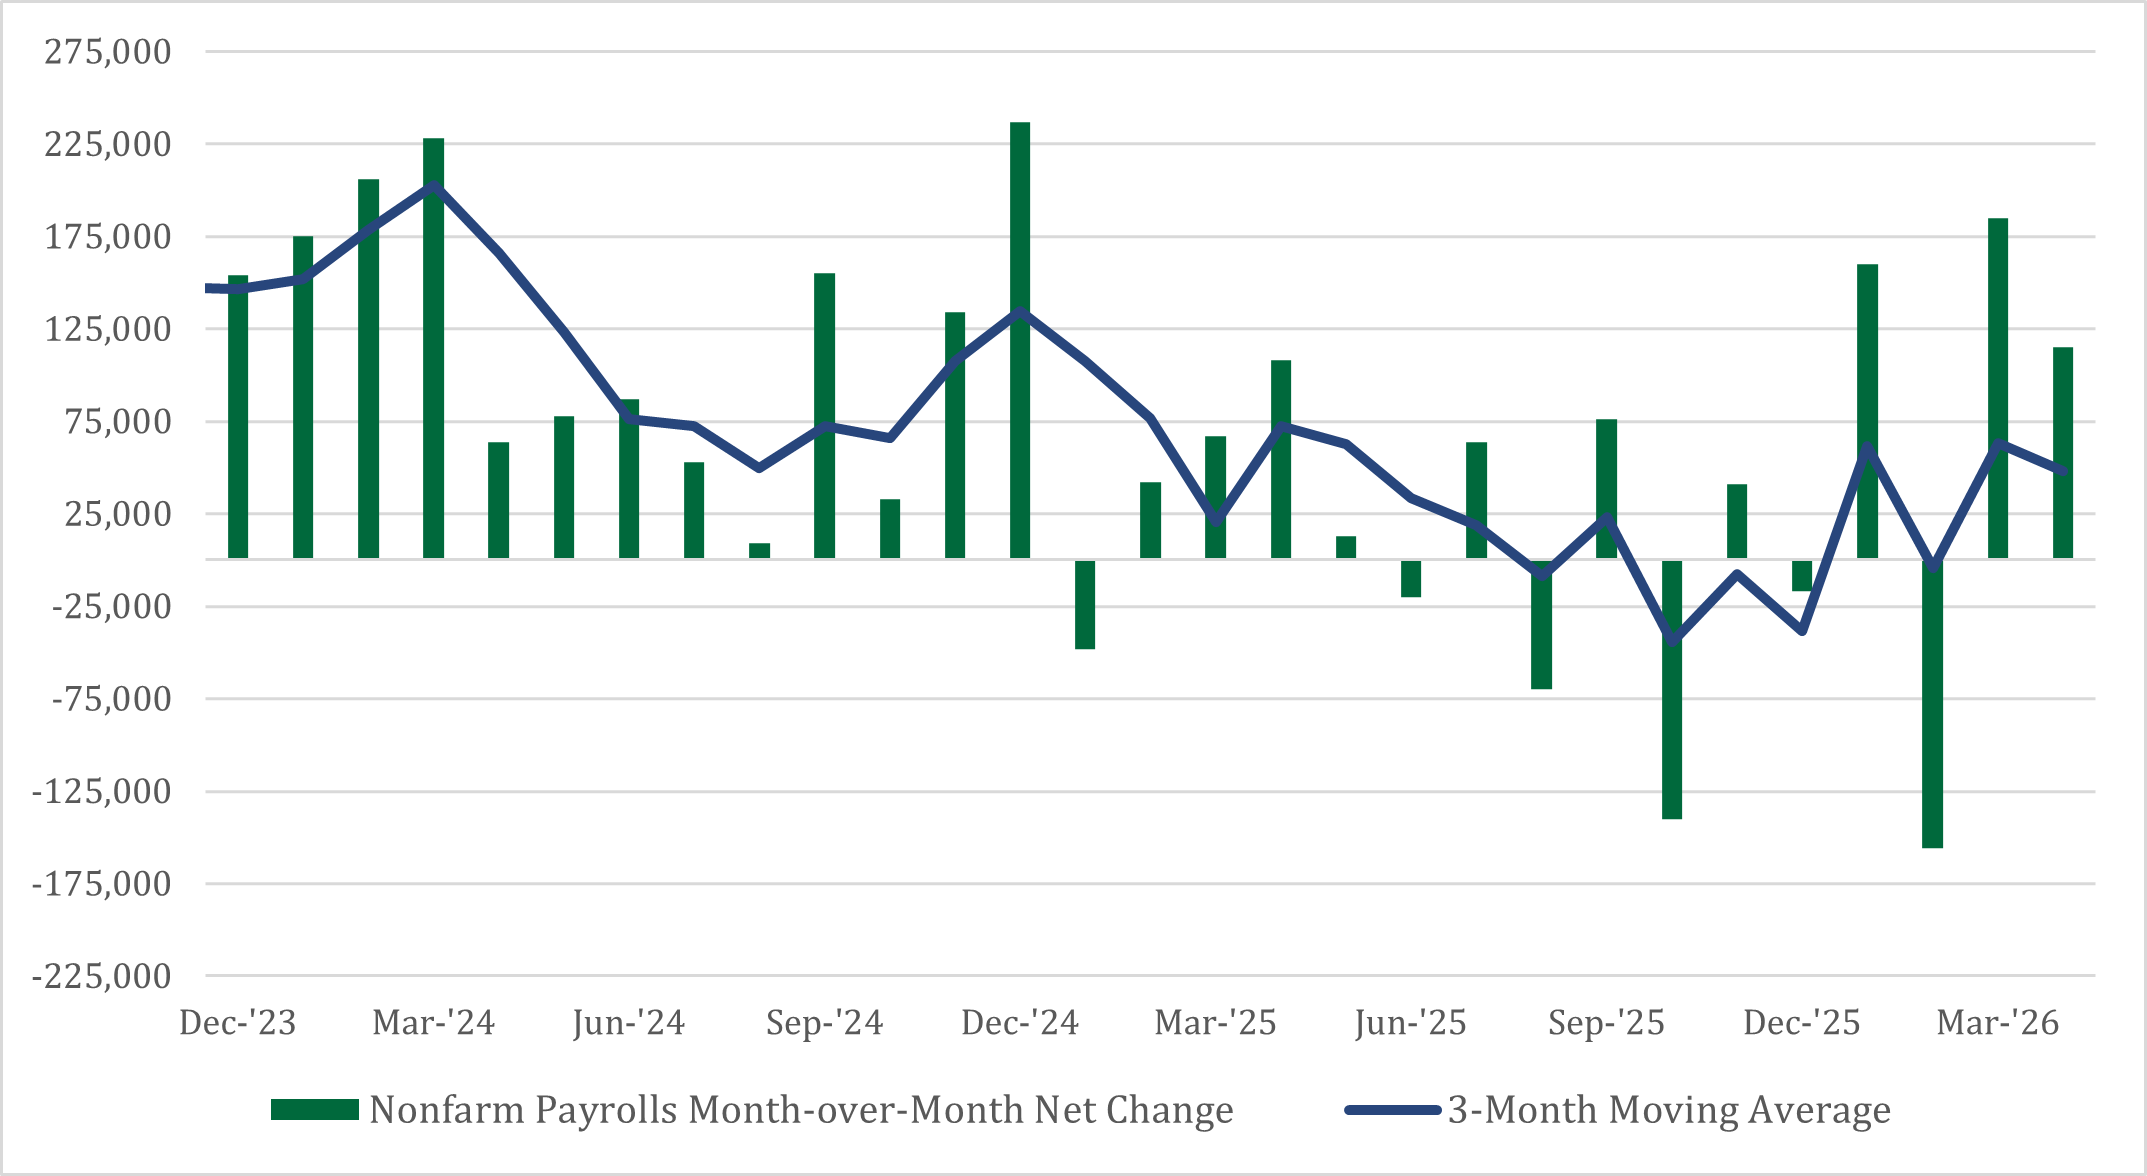
In addition to the lower breakeven rate of job growth, unemployment insurance claims and weekly ADP job gains are consistent with a strong labor market. The level of initial jobless claims has remained below last year’s average. In 2025, monthly jobless claims averaged 224,000, compared to 219,000 so far in 2026, supporting the fact that jobs have not been lost. For this reason, the unemployment rate has held steady at a level below 4.5% since the end of 2021. Private ADP weekly employment gains have accelerated in recent months to a week-over-week net change of 40,000 jobs, which supports the success of the private labor market. Putting all the employment data together, it would appear the most likely cause for the weakness in the labor market assessment is slowing government hiring and the likelihood of the economy being close to full employment.
The second component behind the better economic backdrop is rising capital investment. According to estimates, U.S. private fixed investment is expected to surpass overall growth estimated for the next three years. Over the next three years, private fixed investment is expected to rise more than 3.6% annually, while overall economic growth is expected to rise by around 2% annually. The catalyst behind the better-than-expected growth is investment in the plumbing behind artificial intelligence. For example, 8 companies (the Magnificent 7 and Oracle) are expected to spend nearly $1 trillion in 2028 to grow their capacity by building data centers. This would be more than the U.S. spent on defense in 2025. While fixed investment is a small part of U.S. economic growth, fixed investments can have massive multipliers to the economy that supports job growth and more consumer spending.
RATES SOAR
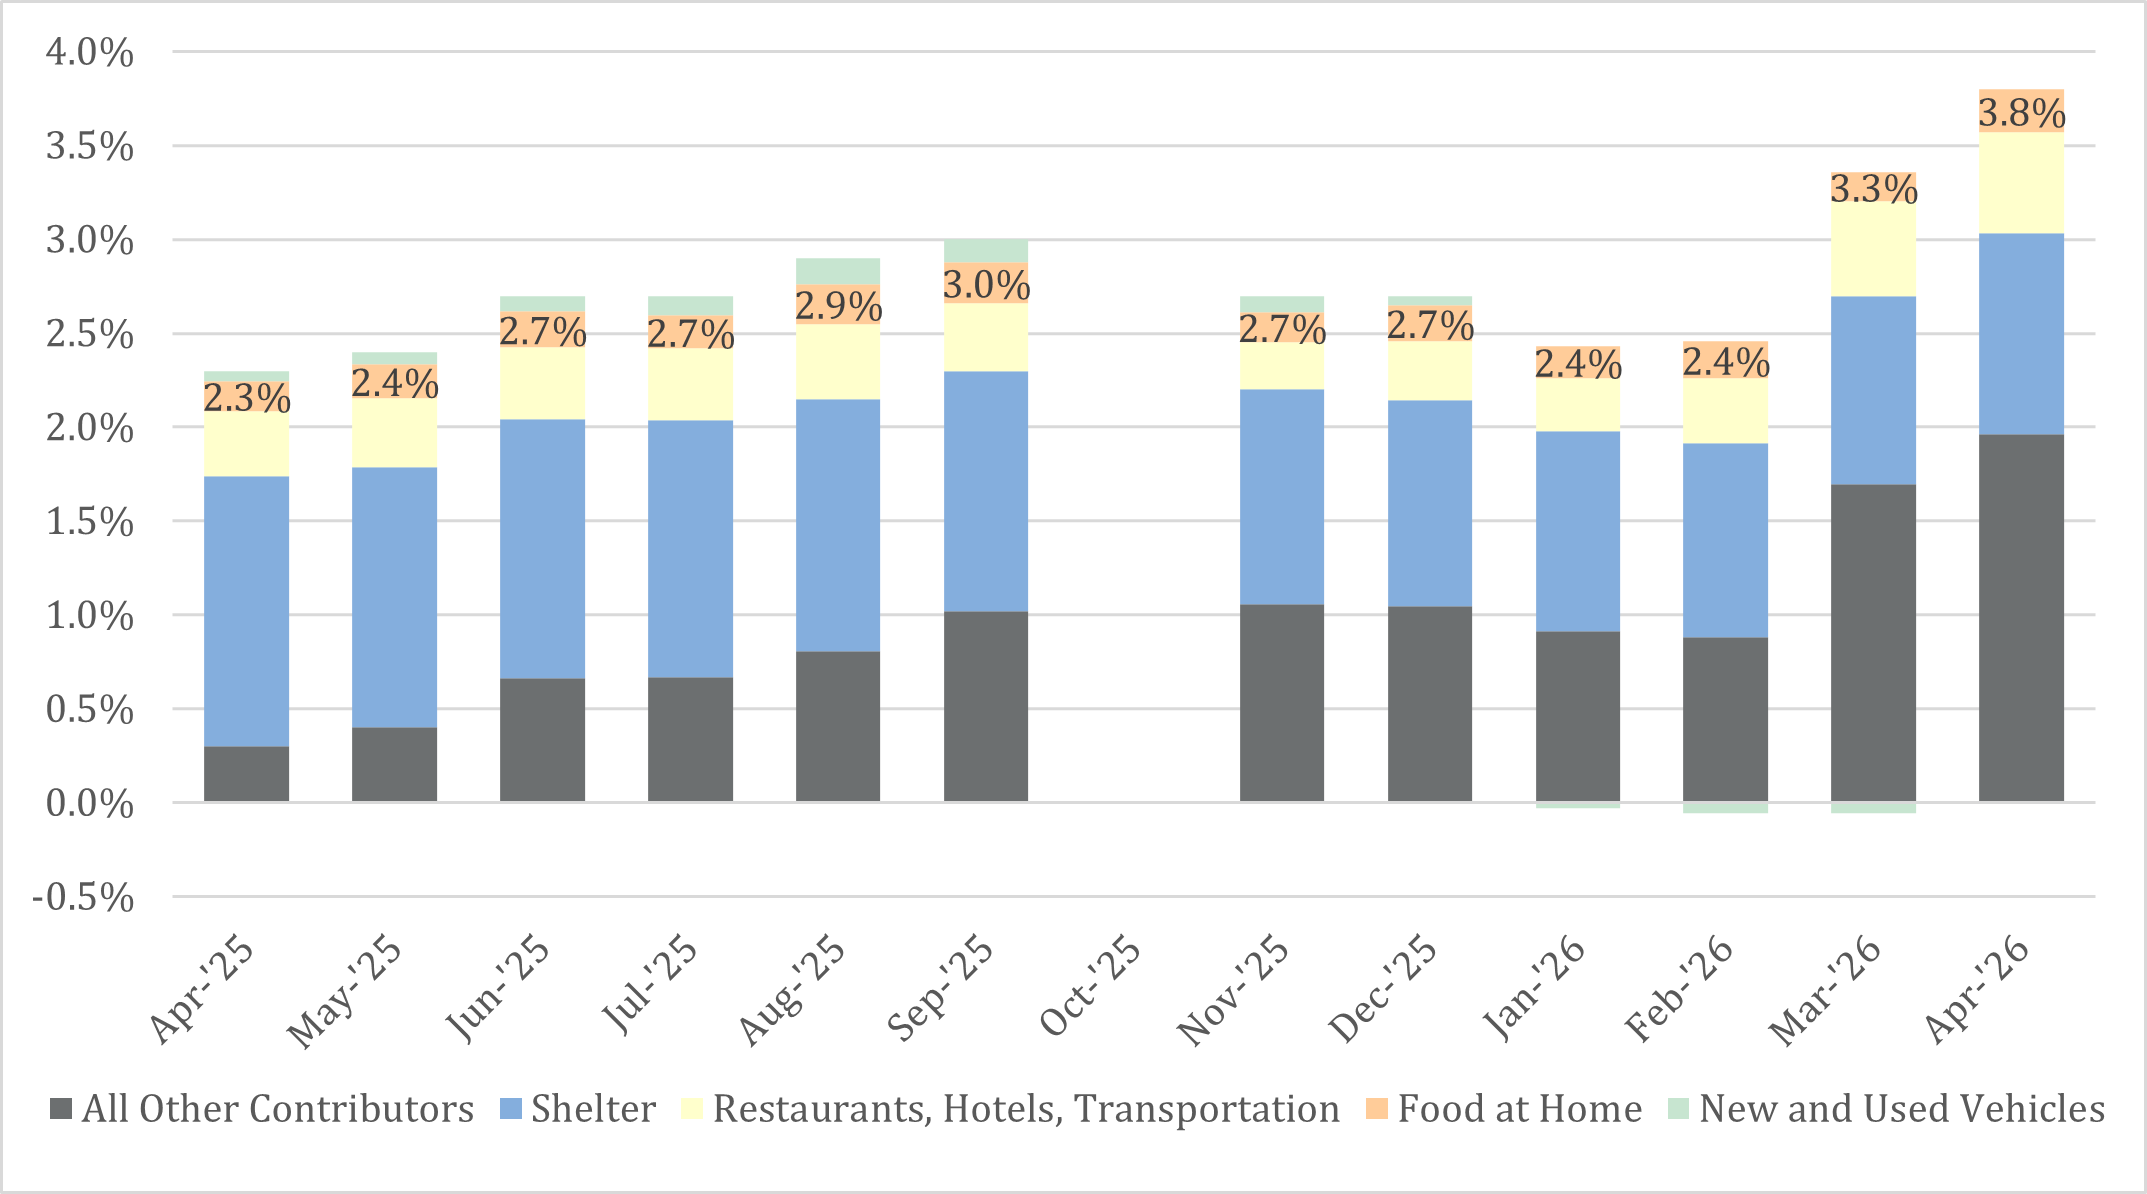
Better economic activity was one of the catalysts behind interest rates stepping higher. From bottoming at 3.94% in February, the 10-year Treasury yield increased to 4.66% in May, an increase of nearly 0.7%. While better global growth is likely the reason behind the interest rate move, inflationary pressures were the spark. Due to the conflict in Iran, the price of oil traded in New York topped $110 per barrel which caused overall consumer prices to rise. The consumer price index, which is a gauge for overall prices in the U.S. economy, increased from a rate of 2.4% year-over-year to 3.8% in April. Interest rates typically increase on unexpected inflation and the rise in oil prices was certainly not expected prior to the conflict in Iran. Going forward, the expectation for higher oil prices for longer is not the base case. However, energy prices will likely be higher than the low-level set in February, which could keep interest rates from moving significantly lower.
Inflation Up Due to Iran, Energy
EARNINGS MOMENTUM
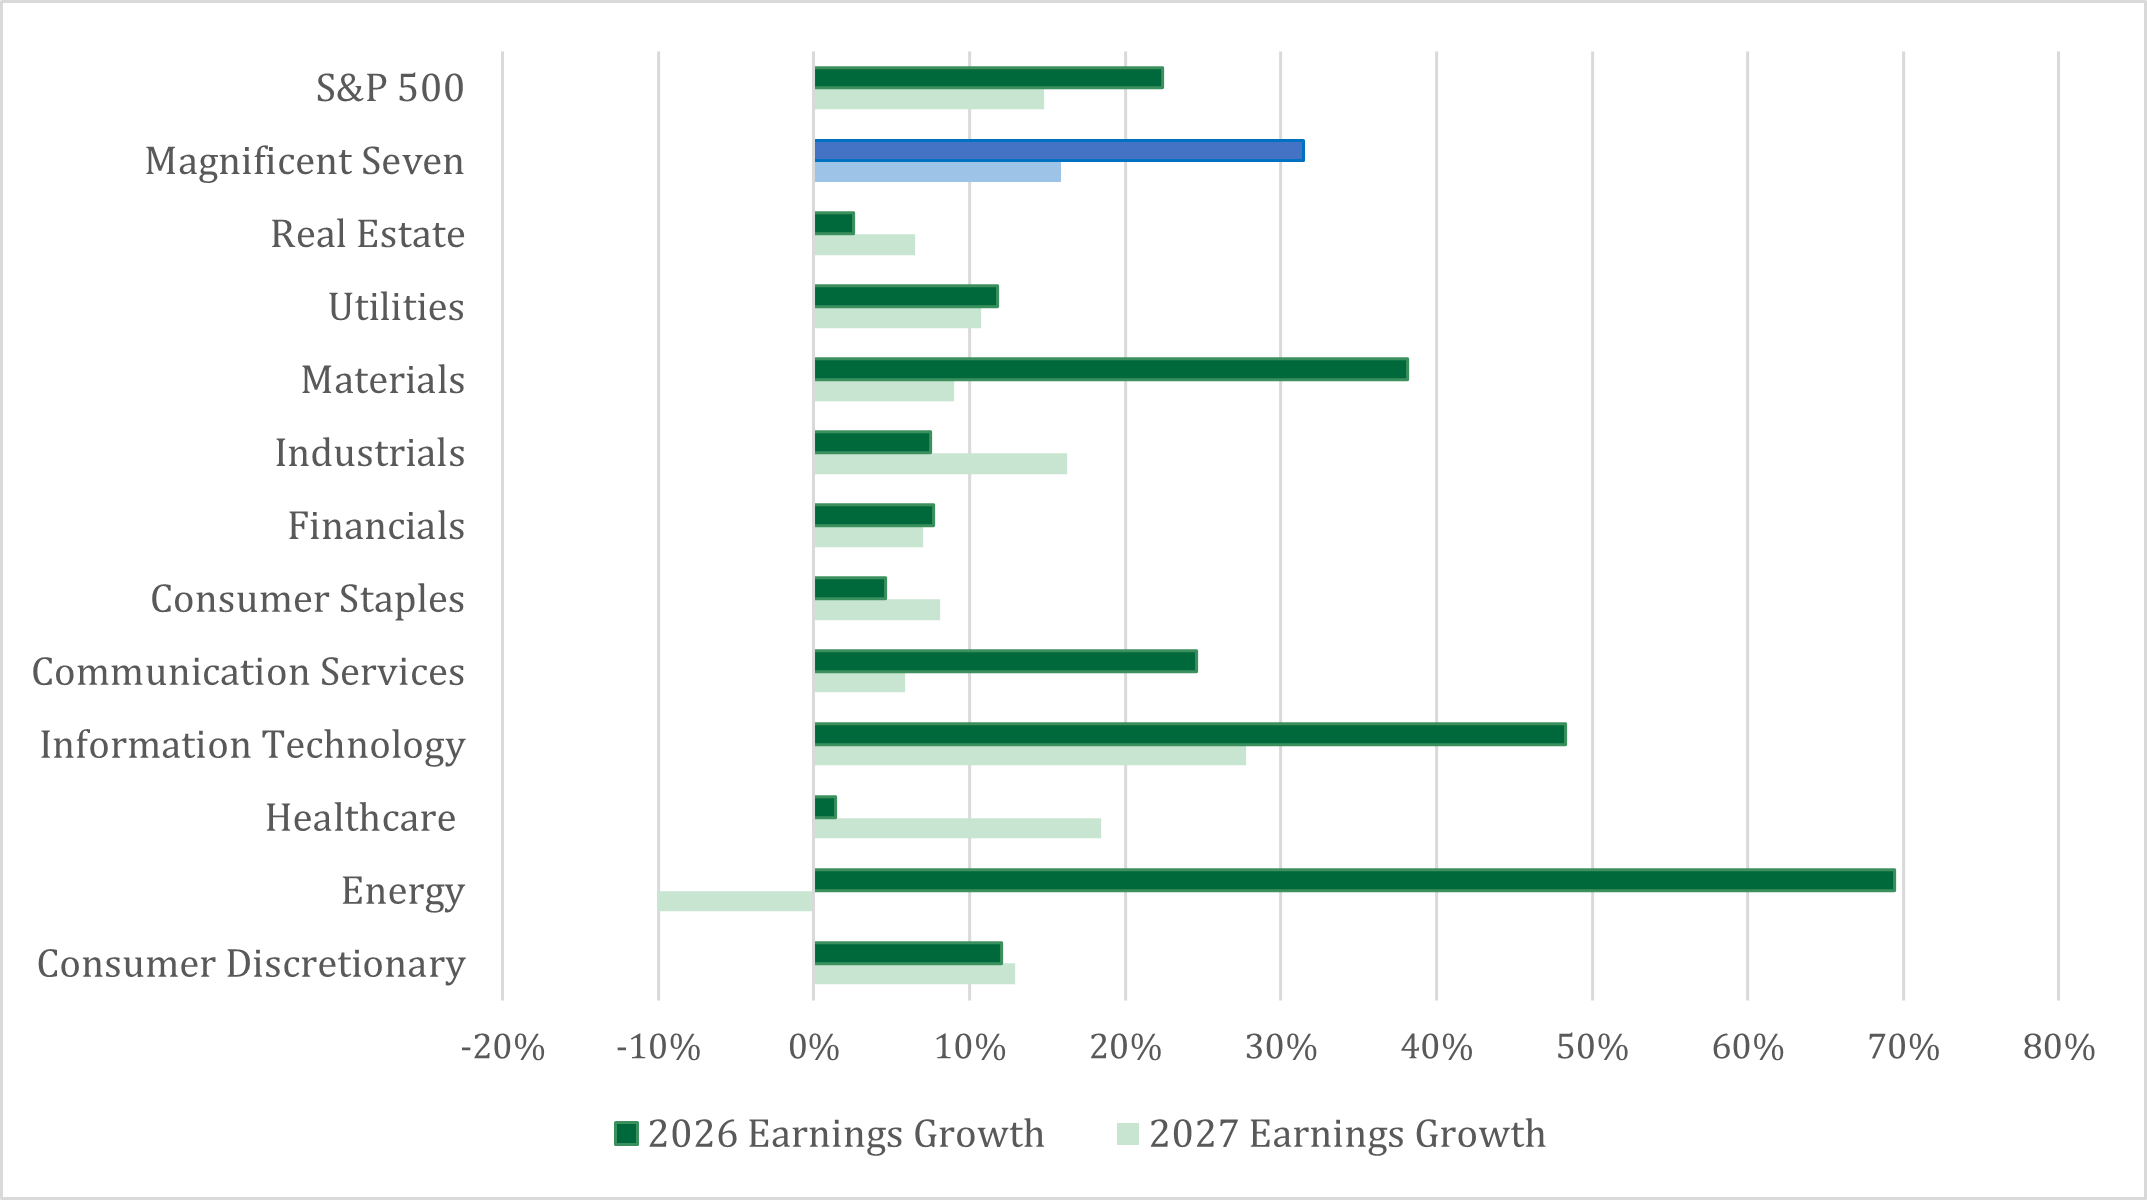
Higher interest rates and an improving economic outlook support a robust earnings environment broadening to other industries. For example, the earnings expectation for small-cap stocks in 2026 and 2027 should total 16% and 17%, respectively. As the massive spending on technology capacity begins to reach other segments of the economy, the pick and shovel segments of the economy stand to benefit the most. Small-cap stocks have a greater share in the financials, industrials, materials, real estate, and energy sectors. These sectors benefit from sustained higher economic growth relative to large cap stocks that have a higher share of technology. The performance of small-cap stocks has started to reflect this better market environment, however the valuation has changed little.
2026 Earnings Growth To Be Led by Mag 7, Information Technology, Materials, Energy
The price investors are willing to value small-cap stocks is at levels last seen in 2023 and close to their 5-year average despite the improving earnings growth. The explanation for the depressed valuation is depressed profitability. However, if earnings continue to improve over the next 2 years in line with expectations, profitability and thus the valuation should rise in tandem.
Viewed from the same lens, U.S. large-cap stocks stand to benefit from greater participation of sectors. Without question, returns have been delivered by the largest technology stocks in the U.S. large-cap universe over the past few years and that has largely continued into 2026. The difference now in the U.S. large-cap universe is broader participation, as value stocks are delivering stronger, albeit trailing, performance relative to growth stocks, but the fundamental picture is improving alongside the growth stock segment. Since the end of February, growth stocks have seen an earnings revision of +10% and value stocks’ earnings revision is about 5% higher. Considering the massive valuation discount, it appears value stocks are not being compensated for improving fundamental prospects.
Stocks Led By Global Market Earnings Surge:
2026 Year-over-Year Earnings Growth
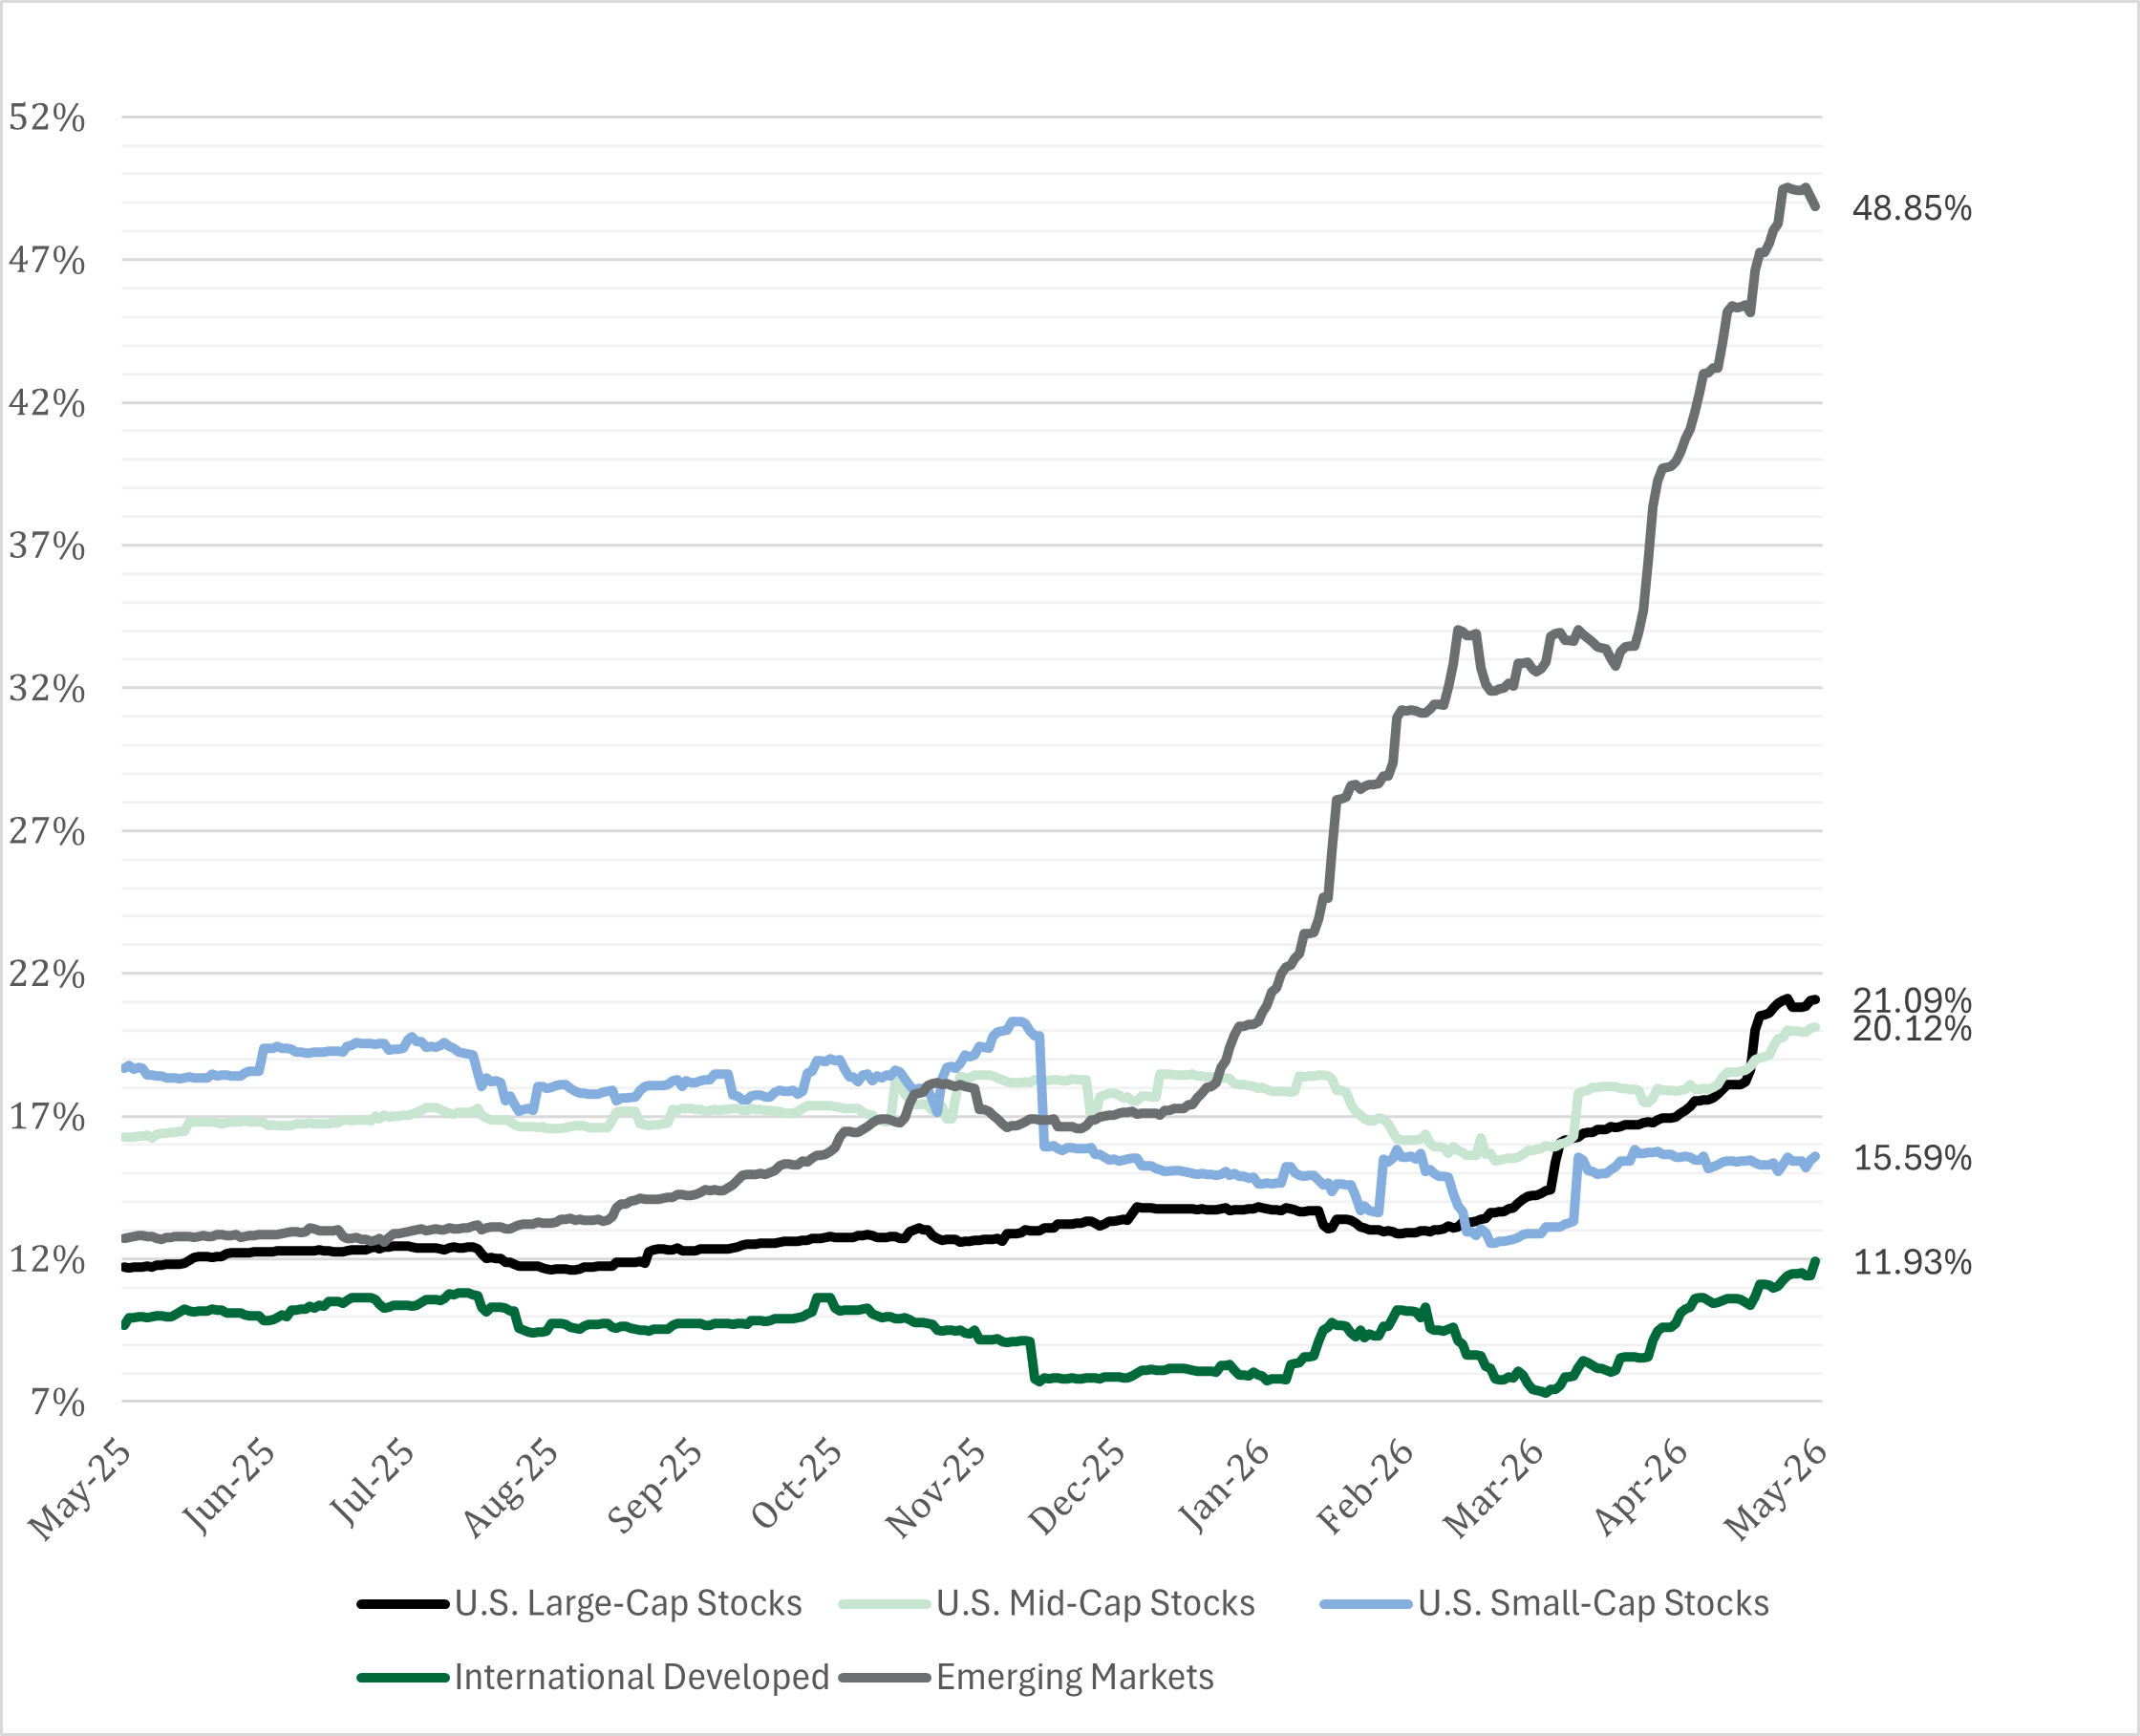
U.S. stocks are not the only asset class seeing significant upside in earnings. Emerging markets earnings growth is expected to rise 48.9% in 2026 and 19.5% in 2027, far surpassing other global markets. Like U.S. markets, technology is the catalyst behind the earnings surge. As a result, emerging market stocks’ performance have tracked earnings, delivering returns of 25.9% year-to-date through May 26th. Different from U.S. markets, the price investors are willing to pay for every unit of earnings is much lower for emerging markets. This reflects the increased uncertainty that remains, as this segment still is susceptible to currency and geopolitical headwinds.
PARTY LIKE IT'S 1999?
While it is easy to make comparisons to 1999, the only real similarity is the strong performance that has resulted from technology, as performance today has been driven by earnings. The S&P 500’s earnings growth in the last five years totaled +79%, which is similar to its total return of +85% over the same period. Compared to the ‘90s, earnings growth totaled +67%, with a resulting return of 220%. These two periods have similarities, but the differences are more pronounced. This doesn’t mean investors shouldn’t be concerned by technology exuberance, just a better understanding of risks, such as concentration and business risk.

Listen & Subscribe to our Podcast
Tune in for the next episode, subscribe or follow us wherever you listen to podcasts.