


VIBRANT ECONOMIC GROWTH
The U.S. economy is most dependent on consumption habits, fluctuating on job and wage growth changes. While this is undoubtedly the most important factor, the U.S. economy is currently going through an evolution. Businesses are finally seeing worthwhile investment projects, looking out to the future, instead of hoarding cash. This has considerable long-term implications, such as economic-wide productivity gains. In addition, history tells us that technological advancements create jobs and industries that are not even a consideration now. These factors should continue to be the catalyst for strong corporate earnings.
INVEST IN THE U.S.A.
While economic growth has come in lower than expected in recent quarters, the positives have more than outweighed the negatives. For example, the economic growth rates over the last two quarters have averaged 1.8%, as slowing government spending and rising imports due to energy and Artificial Intelligence (AI) building costs have weighed on growth. However, private investment has become a positive contributor to growth. Over the last two quarters, private investment growth has totaled 7.9% and 2.7%, surpassing overall economic growth. Particularly, AI-driven business investment and intellectual property investment are expected to contribute the most to growth. On top of the technology-driven private investment, the permanent reinstatement of 100% bonus depreciation has further fueled the major surge in U.S. capital spending. No longer are the largest technology companies returning capital back to shareholders through buybacks and dividends, instead, identifying investment opportunities that will drive business growth.
U.S. Real Economic Growth
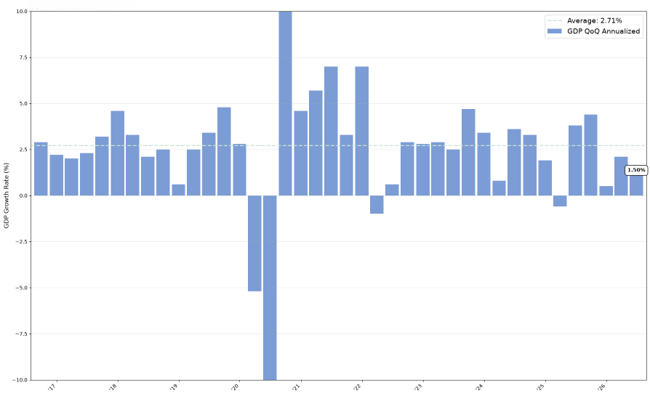
*This “Average” is the mean of the last 10 years of quarterly data
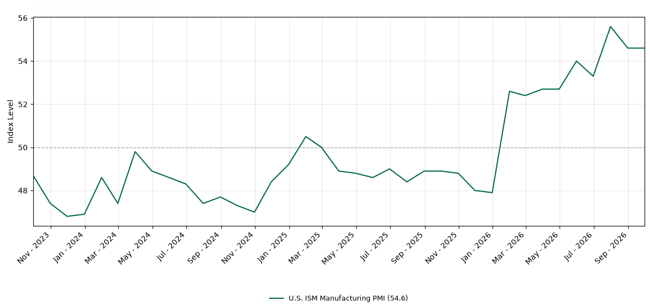
Increased private investment can also be seen in other economic measurements, such as the ISM Manufacturing PMI that remains firmly in expansion territory at 54.6, for an eighth straight month in August. Fifteen manufacturing industries reported growth in August, including primary metals, electrical equipment and appliances. Looking at the various sub-indexes, production, new orders and employment have all advanced or remained in expansion territory.
U.S. Manufacturing PMI
HELP WANTED, INFLATION UNWANTED
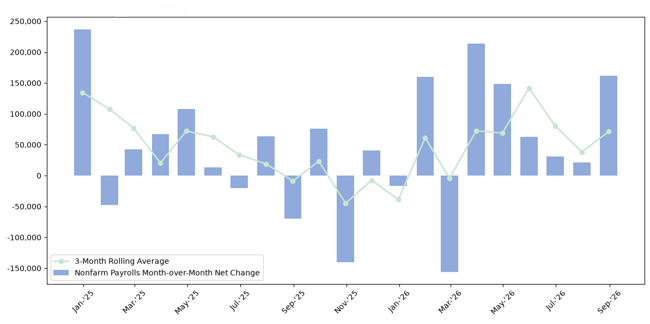
An increasingly diversified economy reinforces an improvement in the job market, which has played out so far this year. The U.S. economy has added nearly 80,000 jobs on average this year, which is above most estimates of the replacement level (enough hiring to support new entrants into the market) and above last year’s average of 10,000. Most surprisingly, the segments of the U.S. economy seeing the greatest momentum include manufacturing, retail, transportation & warehousing, and data centers / technology infrastructure. These new segments of the U.S. are driving growth, but from a negative viewpoint, inflation.
Monthly Payrolls Additions
An economy running at full capacity like it is today usually results in higher inflationary periods. Even if the negative supply shocks from higher oil prices are ignored (energy costs contributed nearly 1% to the Consumer Price Index (CPI) in July, which increased 3.4% on a year-over-year basis), inflation remains above the Federal Reserve’s preference of 2%. The core CPI (consumer prices excluding food and energy) is increasing at a 2.5% year-over-year rate. The implications of sustained higher growth and elevated inflation have fed into a higher interest rate environment.
Contribution to Inflation
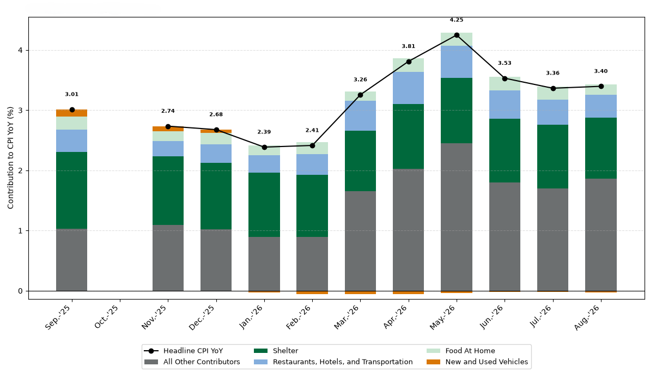
October 2025 data was not reported due to the government shutdown
HOW MUCH HIGHER WILL RATES GO?
One of the most important inputs for the economy, interest rates, have taken multiple steps higher in recent months. The 10-year Treasury yield reached a level of 5.04% on September 15, 2026, which is more than 1% higher than the level set at the end of February 2026. As a reminder, interest rates reflect economic growth and inflation. Without a doubt inflation has been one of the catalysts of interest rates lately, but the recent increase in interest rates is a result of growth. The real 10-year Treasury yield, the interest rate adjusted for inflation, has risen from 1.72% at the end of February 2026 to 2.55%. Almost 80% of the rate increase can be attributed to economic growth, as opposed to higher inflation.
Inflation-Adjusted 10-Year Treasury Yield
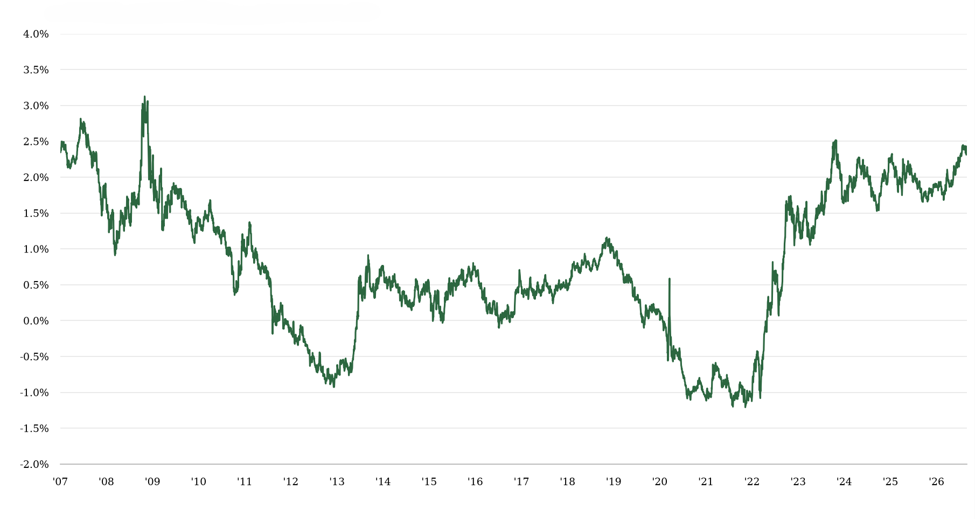
For this reason, the riskiest assets have performed best in 2026. Focusing on bonds, high yield bonds have outperformed the total investment grade bond market by nearly 3%. There are a couple reasons for this performance divergence: 1. Investors’ willingness to take on risk and 2. Riskier bonds have shorter maturities, making them less susceptible to interest rate volatility.
EARNINGS FUELED MARKET
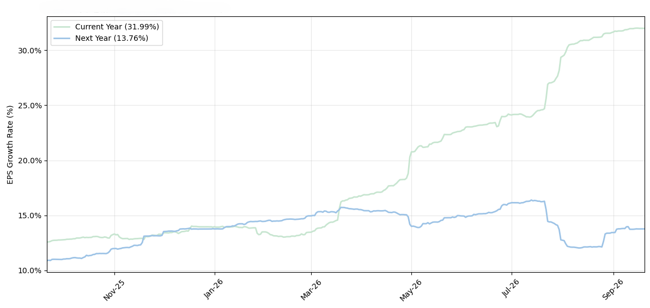
U.S. corporations have been aided by the economic environment, as 2026 earnings growth is rising at 31.6% year-over-year and 2027 earnings growth of 14% year-over-year. This earnings momentum can be directly attributed to the evolution of the AI technology adoption. Putting the magnitude of adoption in perspective, OpenAI’s ChatGPT hit an estimated $10 billion in sales roughly three years after launch, faster than examples like Alphabet (7.3 years), Amazon (8.7), Tesla (9.0), or Meta (9.9). That speed is showing up in results of the largest technology U.S. stocks – earnings growth for information technology is expected to grow 58.8% and 37.6% in 2026 and 2027, respectively. Usage data supports this growth trajectory, too. Alphabet’s monthly token processing (a measurement of AI usage) grew from 9.7 trillion two years ago to roughly 480 trillion last year and then to over 3.2 quadrillion by May 2026, a 7x jump in just a year.
S&P 500 Earnings Growth Outlook
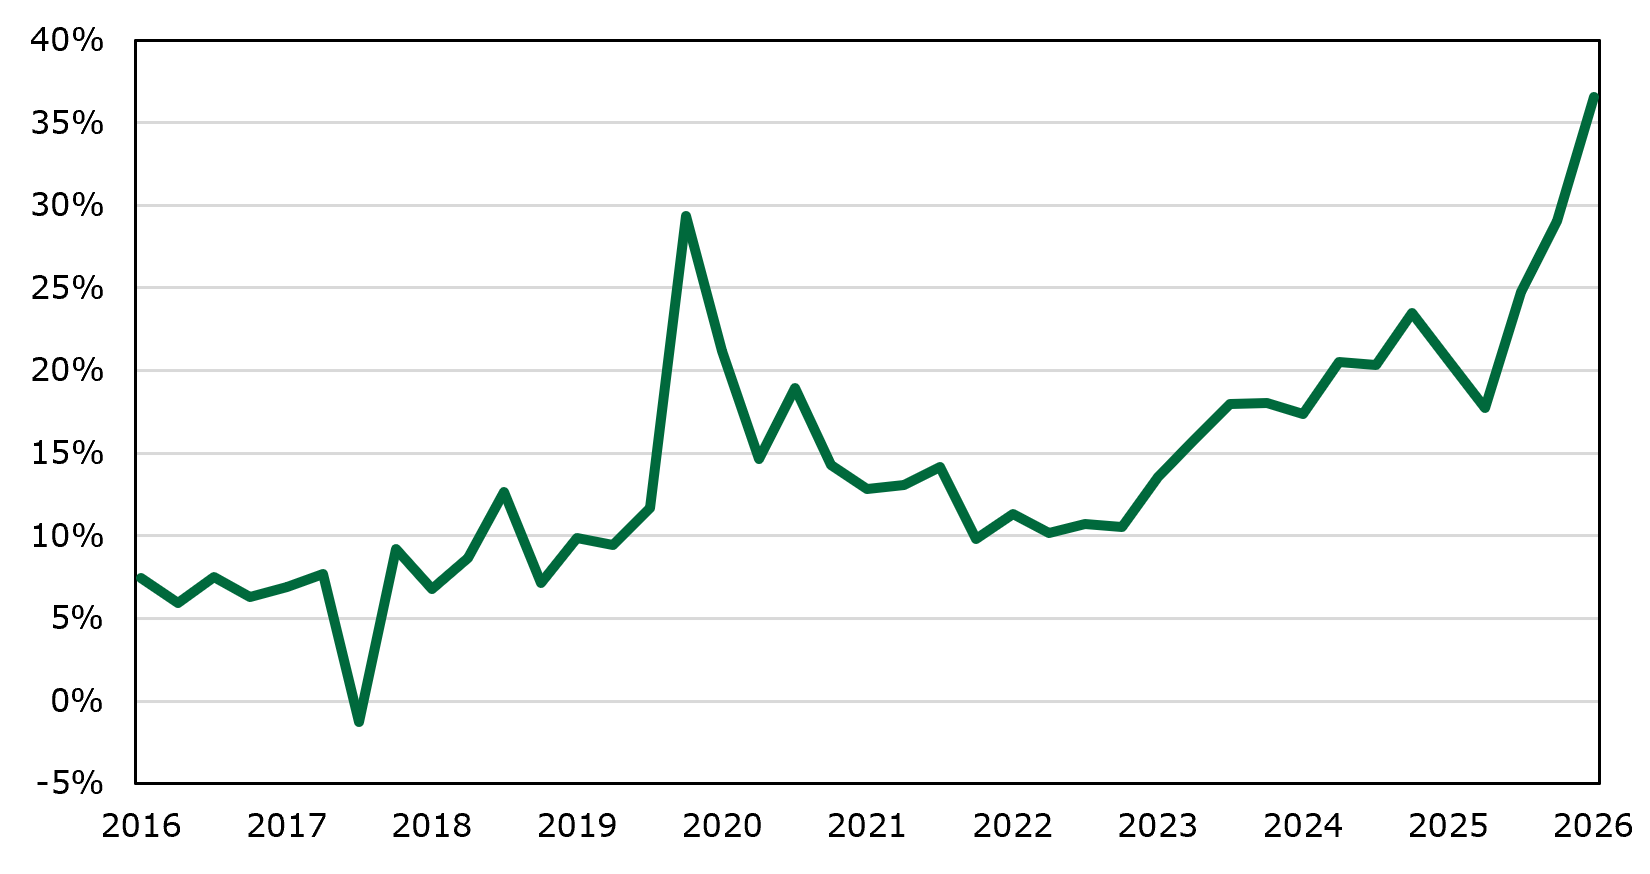
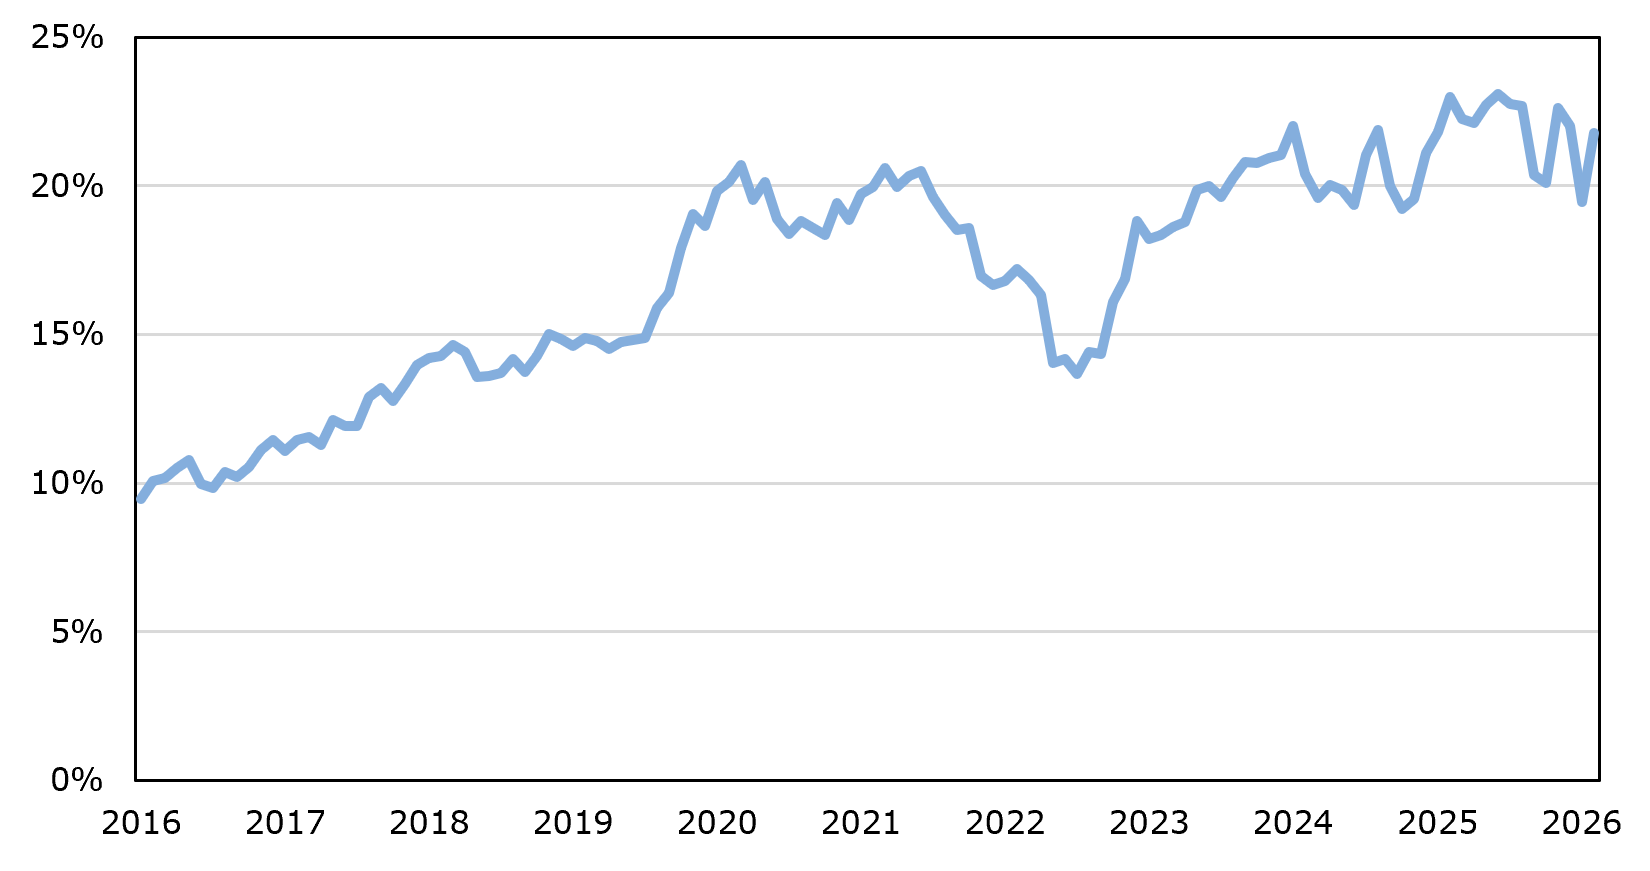
An argument can be made that investors have significantly understated the earnings momentum in the stock market, with valuations still looking conservative relative to earnings power. For example, Meta, Amazon, Alphabet, and Microsoft make up roughly 16% of S&P 500 market cap but generate just over 21% of its earnings, a record-low gap between market-cap weight and earnings weight. On a relative basis, the cohort’s forward P/E (20.2x) sits slightly below the rest of the index (20.8x), despite comparable 5-year EPS growth estimates (18.5% vs. 18.4%). This suggests that the market is growing skeptical over the adoption of technology enhancements, despite the increased usage. According to J.P. Morgan Asset Management Research, current AI use amongst businesses across any business function is just 21%. It is evident there is more room for adoption.
Rising Hyperscaler Share of S&P 500 Earnings
Rising Hyperscaler Share of S&P 500 Market Cap
MARKET BALANCE
There are numerous reasons to believe a positive outlook for the stock market is sustainable. First, the stock market has returned to a “show me” mentality, with returns being justified by earnings starting in 2024 and continuing through 2025 and 2026. Second, earnings growth has broadened to other sectors of the stock market. The “picks and shovels” industries are beginning to ride the wave of the economy, which includes the industrials sector. Third, until recent years, the stock market was fixated on the Federal Reserve’s view on the path of interest rates. However, the stock market has taken tighter monetary policy in strides and remains only 2% below all-time highs set in August. As long as shocks from interest rates and energy prices can be navigated, markets remain on good footing to benefit from the strong earnings environment.
Although we believe it to be reliable as of the publication date and have sought to take reasonable care in its preparation, all information provided is FOR INFORMATIONAL PURPOSES ONLY and we make no representations or warranties regarding its accuracy, reliability, or completeness and assume no duty to make any updates in the event of future changes. Past performance may not be indicative of future market results. Any examples used (including specific securities) are generic and meant for illustration purposes only and are not, and should not be interpreted as, offers to buy or sell such securities. To the extent indices are referenced, please note that you are not able to invest directly in an index.
Nicolet Wealth Management is a brand name that refers to Nicolet National Bank and certain of its departments and affiliates that provide investment advisory, trust, retirement plan level services, and insurance services. Investment advisory services offered through Nicolet Advisory Services, LLC (dba Nicolet Wealth Management), a registered investment advisor.
All investments are subject to risks, including possible loss of principal, and are: NOT FDIC INSURED; NOT INSURED BY ANY FEDERAL GOVERNMENT AGENCY; AND NEITHER DEPOSITS OR OTHER OBLIGATIONS OF, NOR GUARANTEED BY, Nicolet National Bank or any of its affiliates. Neither Nicolet Advisory Services nor its affiliates offer tax or legal advice. You should consult with your legal and tax professionals before making investment decisions.

Listen & Subscribe to our Podcast
Tune in for the next episode, subscribe or follow us wherever you listen to podcasts.