ECONOMIC & MONETARY POLICY UPDATE
Hyperfocus on inflation has been a constant over the past 2 years with every detail being scrutinized for clues on the direction of consumer prices. While inflation has come down, the Federal Reserve’s (Fed) persistence on bringing price growth closer to its long-term goal of 2% is responsible for the move. Whether it’s wages, the Consumer Price Index (CPI), the Personal Consumption Expenditure (PCE) Price Index, or longer-term inflation expectations, the data are elevated, and the Fed intends to remain restrictive until inflation is contained. For example:
• Headline CPI (considers all prices of the economy) increased 3% year-over-year in June, down from 9.1% in June 2022.
• Core CPI (excludes food and energy) rose 4.8% in June, down from 5.9% a year ago.
The main difference between the headline and core data point is the sensitivity to wages, which has proven to be resolute. Core prices are more service oriented and thus determined by wage inputs. In addition, the PCE has also shown signs of abating, declining below 4% for the first time since April 2021. PCE is the Fed’s preferred inflation measurement because its weighting rebalances quarterly to better reflect the economy’s composition.
Labor demand was the key determinant behind elevated wage growth. Nonfarm payroll data exceeded the consensus expectation on the last 15 reports prior to June. Also, the unemployment rate touched a 50+ year low in April. Employment and consumer spending are invariably connected. Consumers still have excess savings (albeit declining), 10 out of the last 11 months of positive real disposable income growth and remain confident to change jobs (the U.S. quits rate remains above last cycle’s peak). A sustainable consumer activity backdrop is positive in the near-term partly because of strong employment but exhibits some level of fragility. The latest nonfarm payroll report in June had a better balance of labor demand and supply, after favoring tight labor demand conditions.
MARKET OUTLOOK
The tranquility of equity markets amidst tighter monetary policy is noteworthy but should be taken with a grain of salt. Volatility of the S&P 500 index, as measured by the VIX Index and referred to as the “fear index”, gives insight into investor conditions. The VIX is currently tracking at depressed levels, reflecting market complacency. Looking back 25 years, the VIX has averaged about 20, while June’s average level totaled just above 14. There is less concern about an imminent recession and more focus on economic growth stabilizing.
The S&P 500 index returned 8.74% in the second quarter, extending the year-to-date rally to 16.88%. Returns were concentrated amongst a few sectors, particularly technology, communication services, and consumer discretionary. The 5 highest contributors to returns can explain 59.7% of the S&P 500 index’s returns, which is a similar return
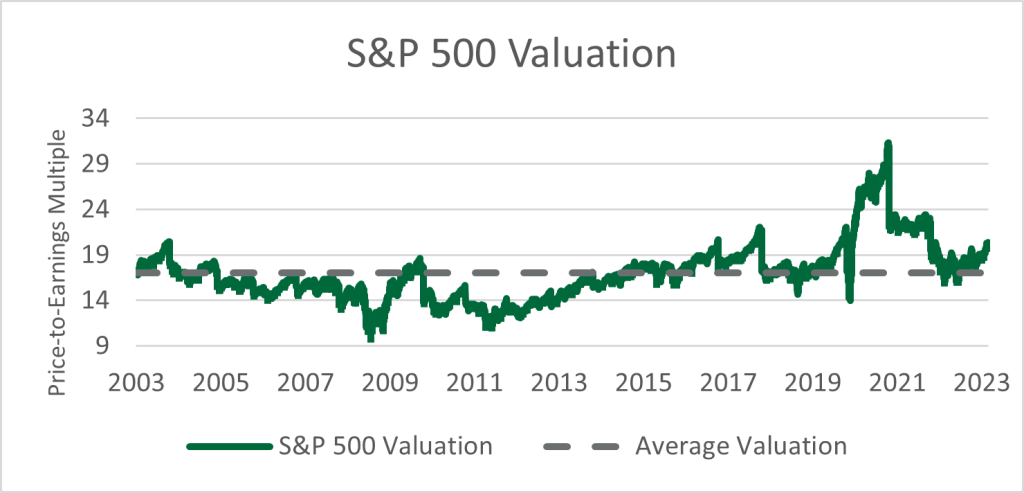
profile to 2020 when a very small segment of the market immediately benefited from the post-covid environment. The concentrated returns underpinned the S&P 500 index’s valuation, advancing to a price-to-earnings multiple of 20 that is above the long-term average of 17. Comparing this to the S&P 500 equal weight index, which eliminates the concentration of a few companies, the price-to-earnings multiple traded below 17 to end the quarter. Investors are effectively expressing a willingness to pay more for declining earnings in 2023, with the expectation of a reversion back to low double-digit growth in 2024 and 2025. Equities are also expensive relative to bonds, as yields now provide a suitable alternative. The 2-year Treasury yield is at a level of 4.75% and the 10-year Treasury yield has a yield of 3.75%. However, valuation is not an effective market timing tool. There are other considerations to equity investments, such as positioning to limit overall risk.
2023 S&P 500 returns driven by multiple expansion.
Equity positioning of value stocks and growth stocks is a common investment strategy because both categories have distinct characteristics. Value has lower future growth prospects, generates more earnings, trades at lower valuations, and generally provides dividends, while growth has higher expected future growth prospects, trades at higher valuations and provides little to no dividends. This explains why value stocks tend to perform relatively better when there is economic growth uncertainty. Investors are navigating 14 months of negative month-over-month leading economic indicator data and are interpreting the signal of an inverted yield curve with stable near-term economic data. Value’s cheaper relative valuation works in its favor during economic uncertainty as the high premium on growth stocks becomes in question. On top of the relative valuation, value’s higher dividend yield becomes desirable. Simply put, a dollar today is better than a dollar promised in the future.
The relationship of bonds and equities was noteworthy during the quarter. Long-term interest rates returned to levels last reached in November 2022, but equities rallied. This contrasts with the end of 2022 when there was a noticeable disconnect. There are two explanations for the deviation. First, the real 10-year Treasury yield (calculated by subtracting expected annual inflation) increased from 0.10% to 1.64%, which equates to a move from very loose to tight conditions. Second, the length of time is a critical factor. It only took two months for the market to price in initial tighter rate conditions. In the second-quarter of 2023, real interest rates increased by 0.60%, but it was over the entire quarter.
While equities should remain resilient in the near-term, market consensus expects the Fed’s tighter for longer campaign to continue into 2024. Tight monetary conditions will eventually weigh on the economy. For this reason, Nicolet Wealth’s Investment Committee determined that it is appropriate to increase the duration of portfolios by extending bond maturities. First, the labor market can provide a strong directional indication of interest rates. While the unemployment rate is at a 50-year low, there are numerous signs that the best is behind us. Initial jobless claims have started to trend higher in concert with labor demand decelerating. The job openings rate declined from 7.40% in March 2022 to 5.90% in May 2023. Historically, there has been a strong relationship between the job openings rate and the unemployment rate. Any meaningful rise in unemployment should be a sign of a weaker labor market that supports risk averse investments. Secondly, the Fed is nearing the conclusion of its interest rate hike campaign. Treasury yields usually peak within a
4-month window around the last rate hike.
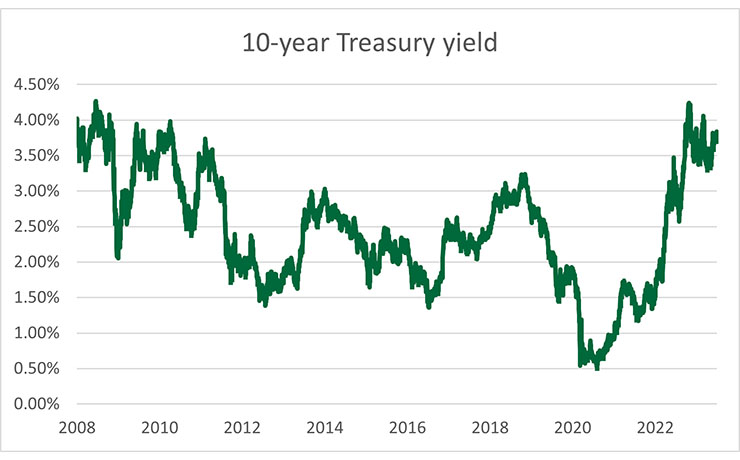
Yields have returned to 2008 levels.
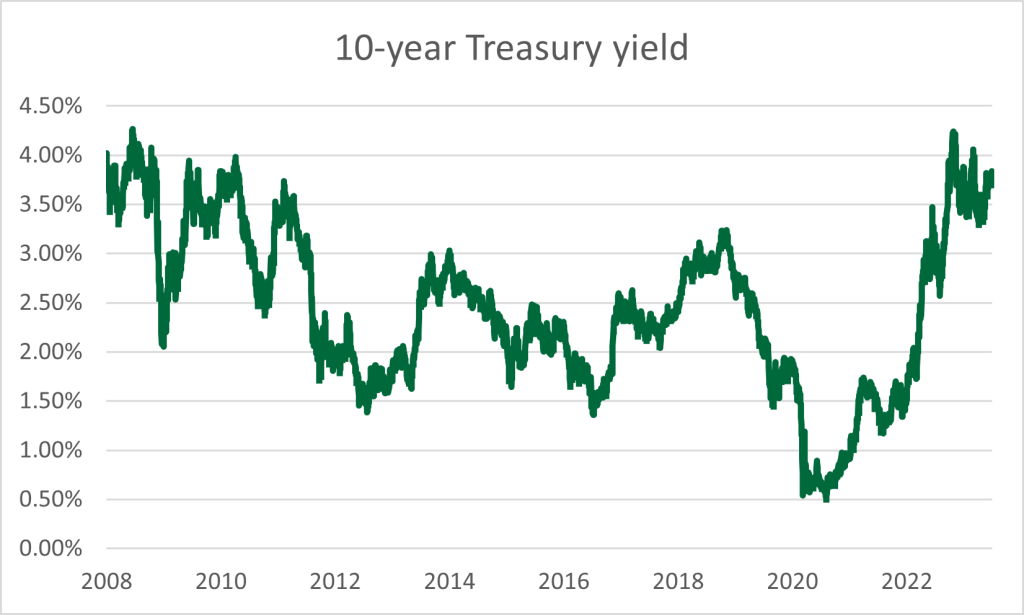
Finally, longer-term rates offer an attractive valuation. The 10-year Treasury yield has returned to levels last reached in 2008-2009, driven by the real component of rates or stronger growth, as opposed to inflation compensation. With inflationary risks more concentrated to the downside as evidenced by inflation expectations, bonds finally offer an attractive real return opportunity. The 10-year breakeven yield has settled around 2.25% from a level of 3.00% in early 2022. Inflation expectations are still elevated over the 10-year average of 1.97%.
CONCLUSION
We continue to reduce risks across the portfolio by rebalancing equities to favor value and lowering the credit risk of fixed income. In addition, a higher cash position was initiated to take advantage of elevated short-term interest rates and opportunities in risk assets as they arise.
Nicolet Wealth Management
Although we believe it to be reliable as of the publication date and have sought to take reasonable care in its preparation, all information provided is FOR INFORMATIONAL PURPOSES ONLY and we make no representations or warranties regarding its accuracy, reliability, or completeness and assume no duty to make any updates in the event of future changes. Past performance may not be indicative of future market results. Any examples used (including specific securities) are generic and meant for illustration purposes only and are not, and should not be interpreted as, offers to buy or sell such securities. To the extent indices are referenced, please note that you are not able to invest directly in an index.
Nicolet Wealth Management is a brand name that refers to Nicolet National Bank and certain of its departments and affiliates that provide investment advisory, trust, retirement planning and insurance services. Investment advisory services offered through Nicolet Advisory Services, LLC (dba Nicolet Wealth Management), a registered investment advisor.
All investments are subject to risks, including possible loss of principal, and are: NOT FDIC INSURED; NOT INSURED BY ANY FEDERAL GOVERNMENT AGENCY; AND NEITHER DEPOSITS OR OTHER OBLIGATIONS OF, NOR GUARANTEED BY, Nicolet National Bank or any of its affiliates. Neither Nicolet Advisory Services nor its affiliates offer tax or legal advice. You should consult with your legal and tax professionals before making investment decisions.