NEW YEAR, NEW MARKET
Ringing in the new year has a wider meaning in 2024. Not only do we say goodbye to 2023, but tighter monetary policy is unlikely to follow. For now, the market has turned its attention to a favorable combination of lower inflation growth and stable economic activity against an uncertain backdrop of interest rate volatility. As a result, risk assets, including stocks and bonds with credit risk, exhibited strong returns in late 2023. While the prospects of sustained long-term positive equity returns are reasonable as we consider tailwinds of productivity through the emergence of artificial intelligence, re-introduction of manufacturing in the U.S. and strong demand for labor, risk asset pricing has outpaced a reasonable expectation of earnings projections. As we progress through 2024, four topics garner the utmost importance for portfolio positioning: Market Concentration, Federal Reserve, Corporate Earnings, and Inflation.
CONCENTRATED MARKET RETURNS
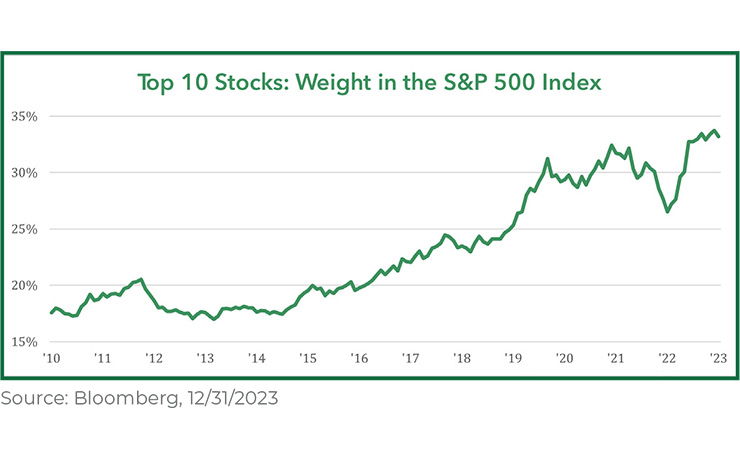
Simply put, market concentration is investment returns driven by only a handful of companies, contrasted to a wide participation amongst most members in a particular market. This delineation is widely followed, due to the insight it provides for assessing the validity of market performance. For example, if there are numerous stocks contributing to returns, then it is thought to be sustainable. On the other hand, if market returns are supported by very few stocks, it tends to lack viability. Last year, investors did not waver from a concentrated return profile, demanding a narrow, specific set of characteristics that ten stocks represented.
The top 10 highest weighted stocks’ shared characteristics in the S&P 500 index last year were high cash levels, low interest expense, industry leadership and high return on capital, as earnings growth security was balanced with economic uncertainty. The sheer outperformance relative to the S&P 500’s remaining members calls in question the sustainability. There only has been one instance greater than last year’s extreme performance difference in the last 30 years, which underscores the unusual position of the market.
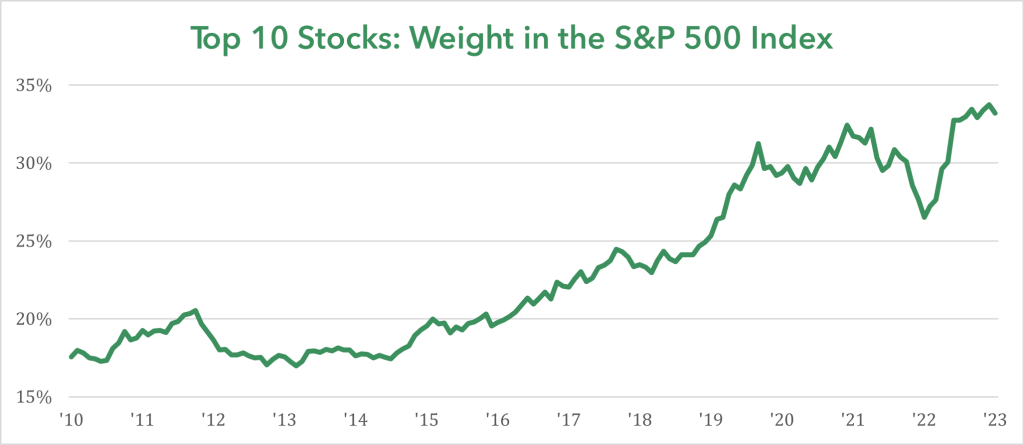
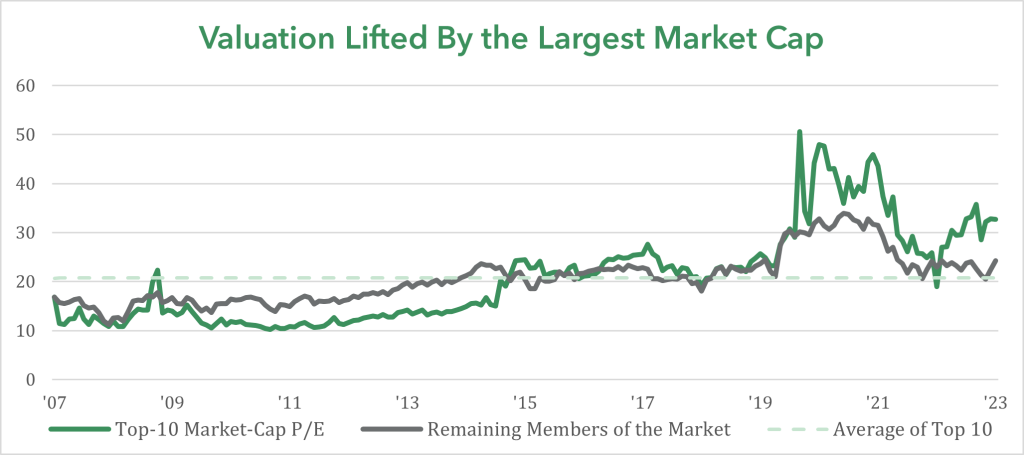
Only time will tell if concentrated market returns continue to pull the weight of the market, but fundamental and valuation trends are reasons for pause. According to Bloomberg data, the concentration of the largest 10 stocks in the market has almost doubled in 8 years from about 17% to 32% in 2023. While the relative weight of the market has increased, earnings have not followed at nearly the same pace. The current earnings contribution of the market totals 22%, up from about 16% in 2016. As a result, the valuation untethered from the overall market and trades about 28% more than the historical average. Remember, where you start is more important than where you finish.
Two things can be true at the same time: it’s unreasonable to expect the largest weighted stocks to live up to their valuations, while not expecting them to precede a market downturn. Markets go in cycles and after vast dispersions in the past, the remaining members of the market typically play catch-up. For example, the 2020-2021 rally in growth led to value outperformance. If the economy provides a suitable backdrop for earnings expansion, the stock market’s least resistance will be higher.

EYES ON THE FED
A pivot in the Federal Reserve’s monetary policy course occurred last quarter, as more pressure was taken off the brake. At the beginning of Q42023, financial instruments that estimate the rate set by the Federal Reserve priced in one rate cut by the middle of 2024. As the quarter progressed, economic activity remained resilient in the face of higher interest rates and inflation drifted towards the long-run goal of 2%. Thus, the need for restrictive policy was reassessed, making considerations for a “soft landing” scenario (lower inflation accomplished by minor slowing of economic growth). By the end of 2023, expectations for rate cuts accelerated, totaling 1% by July 2024 and 1.5% by the end of 2024, noted by the blue dots on the Fed Funds Target graph.
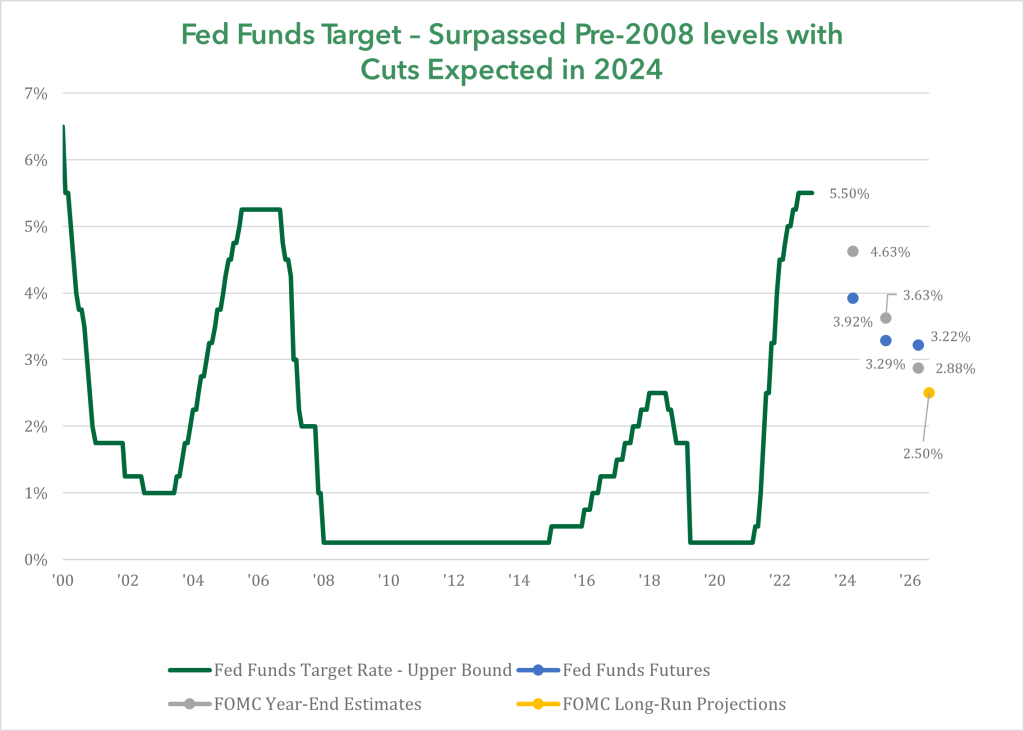
Perception of removing pressure from the proverbial monetary policy brake was confirmed by Federal Reserve chair Jay Powell during the final Federal Open Market Committee (FOMC) meeting in December. Policymaker projections confirmed the markets’ assumption, as the median dot stated FOMC members’ projection of the Federal Funds rate to fall just above 4.5%, implying a cut of 0.75%, noted by the gray dots on Fed Funds Target graph. Fed chair Powell did not try to walk back the FOMC’s rate projection during the press conference immediately after the rate announcement. Most telling was the seemingly strong statement ending the singular focus on slowing the trajectory of inflation to a focus on its dual mandate of inflation and employment. This statement was largely thought to be the pivot that confirmed the trend lower of rates.
EARNINGS OPTIMISM
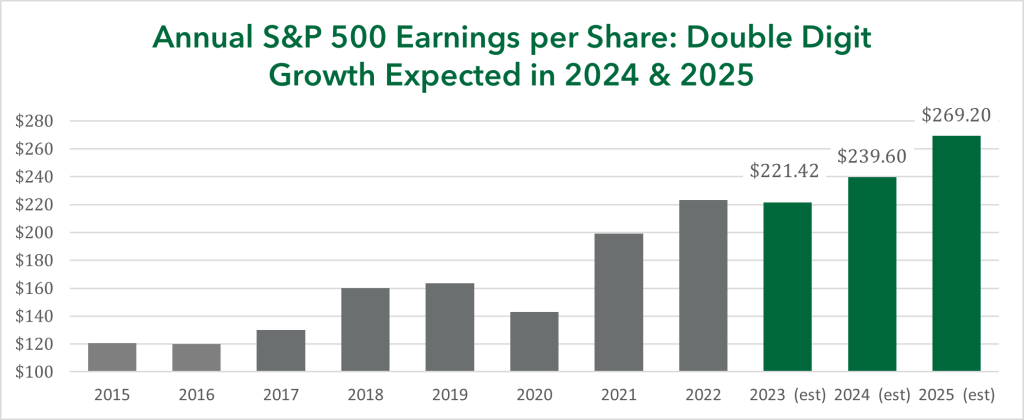
Monitoring earnings trends is a preferred method of measuring economic activity. In fact, the correlation between earnings and the price of the S&P 500 index is high and nearly perfect (97% correlation) going back 70 years. Forward earnings forecasts for 2024 and 2025 encapsulates the recent positive market sentiment with growth of 10% and 12%, respectively.
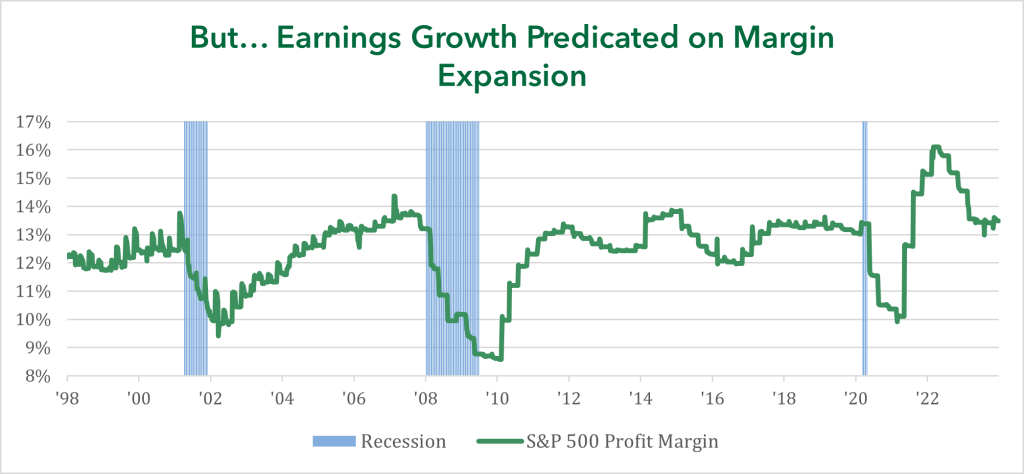
The improvement in earnings over the next year is expected to partially rise alongside sales growth with the primary catalyst being rising profit margins. According to Goldman Sachs research, profitability was primarily driven by declining costs, contributing almost 70% of the total expansion since 1990. While passing along costs to customers was easy early on this business cycle, higher costs tend to catch up and weigh on profitability.
Consistent with recent return catalysts, the market’s earnings profile is expected to be supported by the largest weighted stocks. The top 7 stocks by market weight are expected to grow 19% and 16% in 2024 and 2025 respectively, while “value” stocks or those with lower growth and low valuation are expected to have single-digit growth over the next two years. The bar is set high for the largest weighted stocks to prop up the market going forward.
PRICE GROWTH HELD FIRM BY SHELTER
The Federal Reserve’s tight monetary policy has partially facilitated slowing inflation growth. While inflation remains high relative to the Fed’s target and consumers’ expectations, progress has been made. Inflation growth, as measured by the headline consumer price index (CPI), has settled at a level of 3.1% in November 2023 after topping at 9.1% in June 2022. Separating food and energy from consumer price growth, the year-over-year change has fallen to 4% in November 2023, above the headline inflation growth rate.
Inflation’s stickiness in the headline and core data can be explained by unrelenting costs of housing. While house prices are not directly tallied by inflation data, estimates through rent prices or owners’ equivalent rent is the vehicle in which housing inflation is monitored. First, housing is the biggest component of CPI and it has been the stickiest. The owners’ equivalent rent is still rising at a 6.7% rate year-over-year, only slightly below the 8% level captured in April 2023 and topping both broad measurements of inflation. The path back to the Fed’s preferred rate of 2% falls squarely on housing prices normalizing closer to the long-term average of 3.4%. More real-time measurements of housing costs suggest that pricing is heading back to the long-term average.
PORTFOLIO INSIGHTS – STOCKS AND BONDS PRICED FOR PERFECTION?
A “soft landing” encompasses central banks’ ability to cool inflation and slow the economy without causing a significant decline in economic activity. Historically, the Federal Reserve has not been able to pull off this type of tight rope walking because there’s always unforeseen headwinds with managing monetary policy in a $27 trillion economy. However, recent price action of bonds and stocks substantiates the market’s consensus opinion that a “soft landing” is expected.
The late vice chairman of Berkshire Hathaway, Charlie Munger, said in 2022, “I’ve always believed that nothing was worth an infinite price.” Every asset has an appropriate price, dependent upon earnings potential and the level of interest rates. As of the end of 2023, the price-to-earnings multiple (a gauge to determine whether stocks are cheap or expensive) of the S&P 500 index traded at a level of 22, significantly higher than the average level of 17.
High interest rates have been a significant catalyst behind the extreme valuation of the stock market, due to weaker economic activity encouraging investors to place a premium on stocks with the highest growth potential and the largest weight. On top of this premium, bonds now act as competition to stocks given the upward move in interest rates. Higher interest rate environments provide its own set of uncertainties for equities, but history tells us it’s not prudent to accept elevated risk through extended valuations in the short-term because “nothing is worth an infinite price.”
Bonds are also expressing a similar positive view to the stock market. First, the 10-year Treasury yield has fallen nearly 1% since the end of October to a level just below 4%. Most of the decline has been a combination of repricing of inflation expectations and lessened compensation of buying longer-term interest rates, or the term premium. A minimal amount of the decline in the 4th quarter 2023 was a result of repricing growth expectations. In addition to interest rates, bonds with credit risk have very little compensation relative to treasuries. The Bloomberg corporate bond spread to treasuries is only providing 1% of compensation, below the 10-year average of 1.32%. The Bloomberg high yield corporate bond spread totaled 3.23%, below the average of 4.26%.
Bonds are also expressing a similar positive view to the stock market. First, the 10-year Treasury yield has fallen nearly 1% since the end of October to a level just below 4%. Most of the decline has been a combination of repricing of inflation expectations and lessened compensation of buying longer-term interest rates, or the term premium. A minimal amount of the decline in the 4th quarter 2023 was a result of repricing growth expectations. In addition to interest rates, bonds with credit risk have very little compensation relative to treasuries. The Bloomberg corporate bond spread to treasuries is only providing 1% of compensation, below the 10-year average of 1.32%. The Bloomberg high yield corporate bond spread totaled 3.23%, below the average of 4.26%.

At the end of last year, we rebalanced our portfolios, reducing overall risk by trimming equities to our tactical weights, with the proceeds going into bonds (with limited credit risk, but more interest rate risk). We remain vigilant of risks as the economy reacts to higher interest rates, but at the same time, acknowledge the long-term economic tailwinds that support corporate earnings growth. Investing always comes with uncertainty, but sticking to a carefully designed portfolio remains a key to success over the long-term.
Nicolet Wealth Management
____
Although we believe it to be reliable as of the publication date and have sought to take reasonable care in its preparation, all information provided is FOR INFORMATIONAL PURPOSES ONLY and we make no representations or warranties regarding its accuracy, reliability, or completeness and assume no duty to make any updates in the event of future changes. Past performance may not be indicative of future market results. Any examples used (including specific securities) are generic and meant for illustration purposes only and are not, and should not be interpreted as, offers to buy or sell such securities. To the extent indices are referenced, please note that you are not able to invest directly in an index.
Nicolet Wealth Management is a brand name that refers to Nicolet National Bank and certain of its departments and affiliates that provide investment advisory, trust, retirement planning and insurance services. Investment advisory services offered through Nicolet Advisory Services, LLC (dba Nicolet Wealth Management), a registered investment advisor. Securities offered through Private Client Services, LLC (“PCS”), member FINRA/SIPC. PCS is not affiliated with Nicolet National Bank or Nicolet Wealth Management.
All investments are subject to risks, including possible loss of principal, and are: NOT FDIC INSURED; NOT INSURED BY ANY FEDERAL GOVERNMENT AGENCY; AND NEITHER DEPOSITS OR OTHER OBLIGATIONS OF, NOR GUARANTEED BY, Nicolet National Bank or any of its affiliates. Neither Nicolet Advisory Services nor its affiliates offer tax or legal advice. You should consult with your legal and tax professionals before making investment decisions.