RATES TAKE THE HEADLINES
Interest rates are taking center stage, directly influencing the direction of capital markets. Every maturity across the Treasury curve saw rates advance last quarter, with longer maturities rising the most. In contrast, the change since the beginning of 2023 has been led by higher short-term interest rates, reflecting the Federal Reserve’s (Fed) restrictive monetary policy. The catalyst behind last quarter’s sharp long-maturity rate move (the 10-year Treasury yield advanced 0.7% and the 30-year Treasury yield increased 0.8%) can be debated, whether it’s investors expecting higher rates for longer or the economy necessitating a higher rate to calm inflation. The resulting implication of higher rates across the Treasury curve is tighter conditions for the economy.
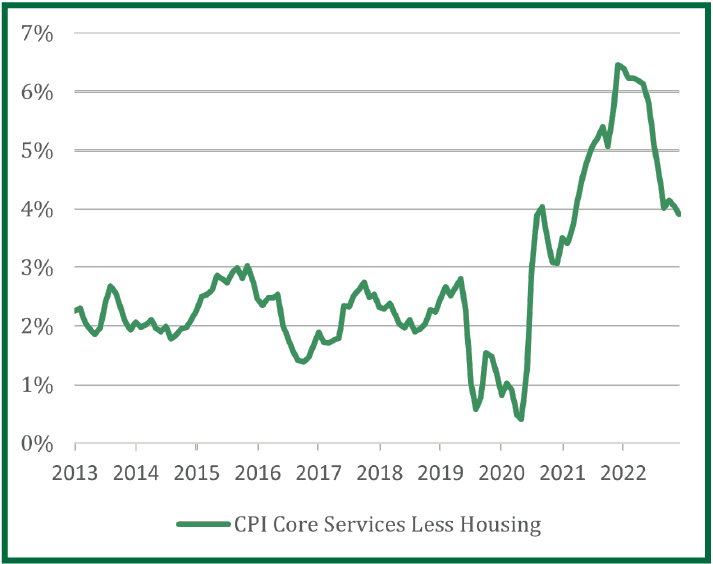
The 10-year Treasury yield can illustrate tighter economic conditions facing the economy because it provides some insight on the cost of borrowing for businesses, which is currently at the highest level in 16 years. This is consistent with the Fed’s objective to control stubborn inflation weighing on the economy. While inflation growth has slowed, as year-over-year consumer price growth decelerated to 3.7% in August (despite a recent uptick this summer on rising energy prices) and core consumer prices (excludes volatile energy and food prices) continues a downward trajectory to 4.3%, both data points remain uncomfortably above the Fed’s target of 2%. Even the CPI core services less housing data point, which is thought to be a targeted measurement of inflation little dependent on cyclicality, remains stuck and elevated around 4%. There are silver linings to the inflation trajectory. The annualized 3- month moving average of core consumer prices has fallen to 2.8%, underlining the better trajectory of inflation in the 3rd quarter of 2023. Also, the market’s expectation for inflation remains anchored, as breakeven rates have settled below 3% this year.
Inflation Remains Above the Federal Reserve’s
2% Comfort Zone
The labor market has been resilient despite the headwinds of higher interest rates. However, there are some reasons for caution. First, nonfarm payrolls’ vigor has slowed. Prior to June, the average monthly growth in jobs for 2023 totaled 287,000. The past three months (June-August), average job growth has totaled 150,000, only slightly above the 100,000 level for job growth to keep unemployment from rising. Second, other labor market indicators such as U.S. job openings (a measurement of labor demand) has fallen from its peak and fewer employees are quitting for other jobs. On a positive note, the unemployment rate is still trending near its 50-year plus low, and U.S. real consumer spending is at a 2.3% level, in line with the 10-year average of 2.7%.
The reaction of capital markets to the changing economic environment and interest rates was comprehensive. In the 3rd quarter of 2023, the S&P 500 index declined -3.3%, Russell Mid-Cap dropped -4.7%, Russell Small-Cap decreased -5.1%, the MSCI EAFE declined -4.0% and the MSCI EM decreased -2.9%. Interest-rate equity substitutes (Real Estate & Utilities) extended underperformance and the Information Technology sectors lagged, a reversal from the first 2 quarters of the year. Real Estate and Utilities compete with bonds, given the sectors’ historically stable and high dividend yield. As rates move higher, risk averse investors prefer a bond’s yield compared with the volatility of an equity. On the other hand, Information Technology does not compete with bonds, and generally exhibits growth that is discounted well into the future. Elevated interest rates cause future earnings to be less valuable. Energy was 1 of 2 sectors to exhibit positive performance (12.2%) during the last quarter on rising oil prices.
Due to Treasury yields rising across the board, bond indexes were not immune to capital market weakness. The U.S. High Yield Corporate Bond Index was the only main bond asset class to have a positive return in the quarter, due to its higher coupon payments relative to the Bloomberg Aggregate Index. The Bloomberg Municipal, Investment Grade and Treasury Indices declined more than 3%.
HIGHER FOR LONGER?
Partly because of the Fed’s aggressive, restrictive monetary policy over the past 20 months, interest rates have shifted higher and altered the investment outlook. Stock market investors’ immediate reaction to elevated rates is often a preference for segments with consistent earnings and low debt levels, due to the destructive nature of rates to margins and sales growth. For example, higher interest rates erode margins as it raises the cost of financing and weighs on sales growth if consumers have a lessened ability to afford goods and services. However, the level of interest rates has positive connotations.
Long-term maturity interest rates provide an estimate of economic growth. Put simply, higher growth equates to higher interest rates. After being at depressed levels for more than a decade, the 10-year Treasury yield advanced to 4.57% at the end of the third quarter. Effectively the market expects nominal growth (real growth plus inflation) to rise and if sustained, better growth prospects would lead to interest rates tracking levels pre-2008 when the 10-year yield averaged about 4.40%.
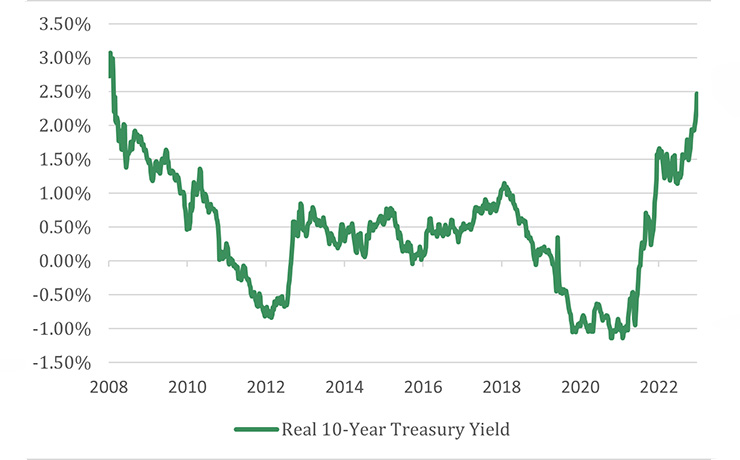
Real Treasury Yield Reaches the Highest Level Since 2008
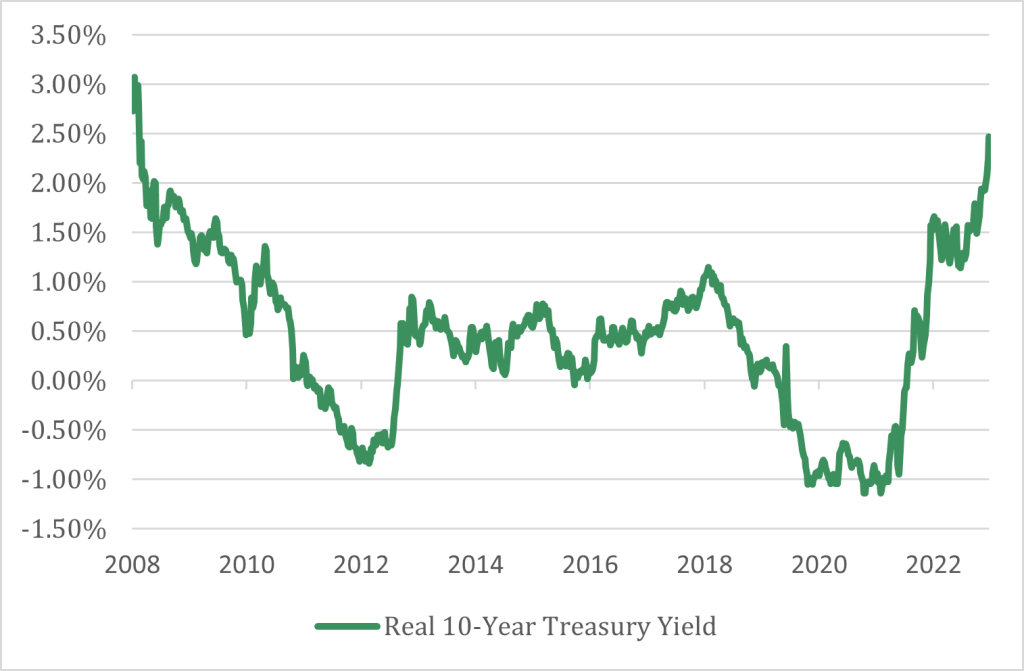
Real interest rates are a good example of changing market dynamics. The real 10-year Treasury yield (Treasury yield minus expected inflation) rose to the highest level in 15 years or about 2.50%. This is an indication of accelerating growth, a complete reversal from 2009-2020 when the average level totaled 0.8%. A few reasons can explain this upward trend. First, strong consumption has led to a declining personal savings rate (personal saving as % of disposable income). After the savings rate peaked at 32% on government assistance during the COVID-19 pandemic, it has fallen below the 20-year average of 5.9%. Second, the explanation for sustained higher real yields is greater investment in the economy through housing and longer-term capital expenditure trends, potentially providing a boost to productivity. According to Goldman Sachs research, artificial intelligence spending could boost $7 trillion in global economic growth over a 10-year period, or about a 1.5% annual increase in productivity.
VALUE STOCKS OPPORTUNITY?
The evolving landscape of higher interest rates for longer alters investors’ outlook, particularly for equities. There are now alternatives to mega-cap technology growth stocks, as valuation becomes a relevant consideration again. Investors no longer need to put a premium on companies/sectors generating the best profit margins because earnings are more ubiquitous. The current 20-year average earnings multiple (the price an investor pays for a unit of earnings) is about 17, which is below the current level of 20. Rising economic prospects shift attention from the concentrated group of growth stocks that are expected to produce future growth to value stocks generating earnings presently.
Value only outperformed during short periods since 2009, as its earnings momentum has been inconsistent. This would occur during short upward moves in interest rates, given the cyclical nature of value. However, changing long-term tailwinds through higher interest rates for longer could begin to support value consistently going forward. Also, value has relatively higher dividends, which adds to its total return profile, on top of an improving outlook and a better valuation. Put differently, Financials, Industrials, and Energy sectors are sizeable in the value bucket and depend on broad growth to display sustainable performance relative to the growth bucket but have dividends at cheaper valuations. After years of lagging, the market environment appears to be setting up for value moving forward.
Nicolet Wealth Management
Although we believe it to be reliable as of the publication date and have sought to take reasonable care in its preparation, all information provided is FOR INFORMATIONAL PURPOSES ONLY and we make no representations or warranties regarding its accuracy, reliability, or completeness and assume no duty to make any updates in the event of future changes. Past performance may not be indicative of future market results. Any examples used (including specific securities) are generic and meant for illustration purposes only and are not, and should not be interpreted as, offers to buy or sell such securities. To the extent indices are referenced, please note that you are not able to invest directly in an index.
Nicolet Wealth Management is a brand name that refers to Nicolet National Bank and certain of its departments and affiliates that provide investment advisory, trust, retirement planning and insurance services. Investment advisory services offered through Nicolet Advisory Services, LLC (dba Nicolet Wealth Management), a registered investment advisor.
All investments are subject to risks, including possible loss of principal, and are: NOT FDIC INSURED; NOT INSURED BY ANY FEDERAL GOVERNMENT AGENCY; AND NEITHER DEPOSITS OR OTHER OBLIGATIONS OF, NOR GUARANTEED BY, Nicolet National Bank or any of its affiliates. Neither Nicolet Advisory Services nor its affiliates offer tax or legal advice. You should consult with your legal and tax professionals before making investment decisions.